
Page 390 - Math Smart - 7
P. 390
In this chapter
CHAPTER 17.1
Pupils should be able to:
• find the mode (or modal
class for grouped data),
median and range
• calculate the mean,
including from a simple
^firsT^ rr
frequency table
• compare two simple
distributions using the
range and the mode,
We have learnt in Stage 6 some ways to interpret a given set of data by finding an
median or mean
average of the given data set An 'average' is a 'typical' value of the data set. It is
usually a 'middle' value and tells us approximately what most of the values in the
^ RECALL data set are close to. We can also call this the 'central tendency'.
There are three types of average — mean, median and mode.
Find the mean, median,
mode and range of the set
Mode
of values.
29 32 21 45 9 41 17 32 Mode is the value that occurs the most often. Let us see how we can find the
mode of a given data set.
Mean Median
Finding mode in discrete or ungrouped data set
Mode Range
Discrete data contains values that can be counted and has a finite number of
possible values. For example, days of the week or shoe sizes.
We do not need to group |
these values, hence [
we call it discrete or j
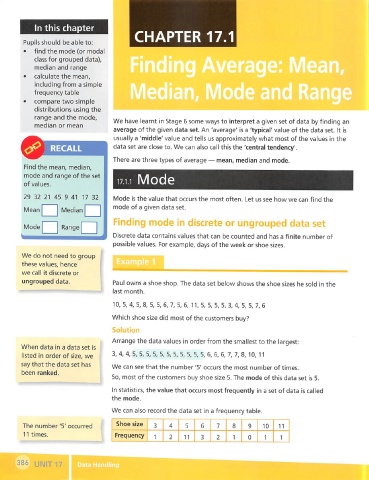
ungrouped data. Paul owns a shoe shop. The data set below shows the shoe sizes he sold in the
last month.
10, 5, 4, 5, 8, 5, 5, 6, 7, 5, 6, 11, 5, 5, 5, 5, 3, 4, 5, 5, 7, 6
Which shoe size did most of the customers buy?
Solutioii
Arrange the data values in order from the smallest to the largest:
When data in a data set is
listed in order of size, we 3, 4, 4, 5, 5, 5, 5, 5, 5, 5, 5, 5, 5, 5, 6, 6, 6, 7, 7, 8, 10, 11
say that the data set has
We can see that the number '5' occurs the most number of times.
been ranked.
So, most of the customers buy shoe size 5. The mode of this data set is 5.
In statistics, the value that occurs most frequently in a set of data is called
the mode.
We can also record the data set in a frequency table.
The number '5' occurred Shoe size 3 4 5 6 7 8 9 10 11
11 times. Frequency
1 2 11 3 2 1 0 1 1
386 UNIT 17 Data Handling