Page 205 - SCIENCE DLP T6 SK (SEMAKAN 2017)
P. 205

6.   Steps:
                 (a) Put a cardboard on a table.
                 (b) Arrange the paper cups on a cardboard.

                 (c) Move the cardboard front and back repeatedly.
                 (d) Record the time taken when any of the paper cups begin to fall.
                 (e) Record your observation in a table.
                 (f)  Repeat steps 6(a) to 6(e) by increasing the structural height
                    of the paper cups.


             7.   Data:
             8.   Interpreting Data:

                 (a)  Which model structure is more stable? Why?
                 (b)  What is the relationship between the height of the model structure

                     and its stability?
             9.   Conclusion:


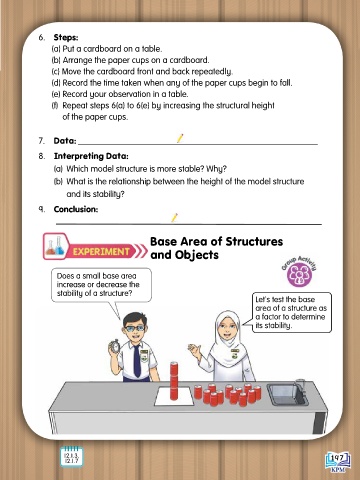
                                              Base Area of Structures

                                              and Objects


                  Does a small base area
                  increase or decrease the
                  stability of a structure?
                                                                              Let’s test the base
                                                                              area of a structure as
                                                                              a factor to determine
                                                                              its stability.


                    12.1.3,                                                                          197
                     12.1.7
   200   201   202   203   204   205   206   207   208   209   210