
Page 182 - Jurnal Kurikulum BPK 2020
P. 182
RESULTS
Due to a small sample size and the nature of the study (action research), caution must
be applied as the results of this research might not be transferable to other matriculation
students. Both research questions would be analysed using descriptive and inferential statistics.
For research questions 1 and 2, Table 2 would present the results descriptively (means of
reading scores for each group). Meanwhile, Table 8 provides the inferential statistics for
research questions 1 and 2.
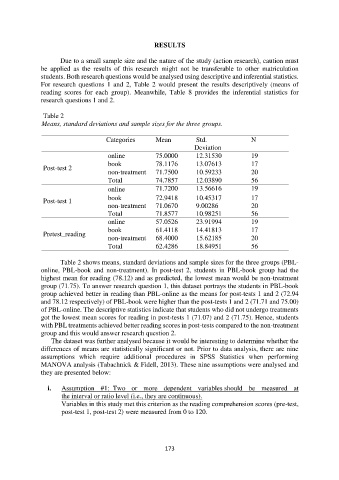
Table 2
Means, standard deviations and sample sizes for the three groups.
Categories Mean Std. N
Deviation
online 75.0000 12.31530 19
book 78.1176 13.07613 17
Post-test 2
non-treatment 71.7500 10.59233 20
Total 74.7857 12.03890 56
online 71.7200 13.56616 19
book 72.9418 10.45317 17
Post-test 1
non-treatment 71.0670 9.00286 20
Total 71.8577 10.98251 56
online 57.0526 23.91994 19
book 61.4118 14.41813 17
Pretest_reading
non-treatment 68.4000 15.62185 20
Total 62.4286 18.84951 56
Table 2 shows means, standard deviations and sample sizes for the three groups (PBL-
online, PBL-book and non-treatment). In post-test 2, students in PBL-book group had the
highest mean for reading (78.12) and as predicted, the lowest mean would be non-treatment
group (71.75). To answer research question 1, this dataset portrays the students in PBL-book
group achieved better in reading than PBL-online as the means for post-tests 1 and 2 (72.94
and 78.12 respectively) of PBL-book were higher than the post-tests 1 and 2 (71.71 and 75.00)
of PBL-online. The descriptive statistics indicate that students who did not undergo treatments
got the lowest mean scores for reading in post-tests 1 (71.07) and 2 (71.75). Hence, students
with PBL treatments achieved better reading scores in post-tests compared to the non-treatment
group and this would answer research question 2.
The dataset was further analysed because it would be interesting to determine whether the
differences of means are statistically significant or not. Prior to data analysis, there are nine
assumptions which require additional procedures in SPSS Statistics when performing
MANOVA analysis (Tabachnick & Fidell, 2013). These nine assumptions were analysed and
they are presented below:
i. Assumption #1: Two or more dependent variables should be measured at
the interval or ratio level (i.e., they are continuous).
Variables in this study met this criterion as the reading comprehension scores (pre-test,
post-test 1, post-test 2) were measured from 0 to 120.
173