Page 185 - Jurnal Kurikulum BPK 2020
P. 185

The scatterplot matrices generally moving from left to the top right. So, the assumption
                       of linear relationship was not violated.

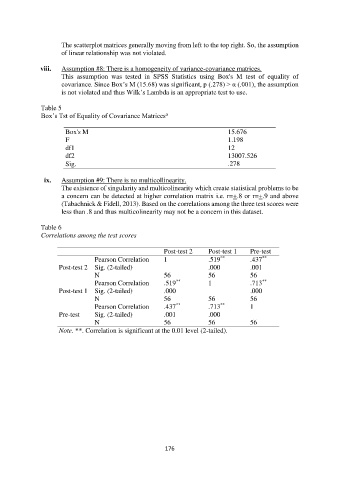
               viii.   Assumption #8: There is a homogeneity of variance-covariance matrices.
                       This  assumption  was  tested  in  SPSS  Statistics  using  Box's  M  test  of  equality  of
                       covariance. Since Box’s M (15.68) was significant, p (.278) > α (.001), the assumption
                       is not violated and thus Wilk’s Lambda is an appropriate test to use.

               Table 5
               Box’s Tst of Equality of Covariance Matrices a
              Table 5
                        Box's M                                                  15.676
                        F                                                        1.198
                        df1                                                      12
                        df2                                                      13007.526
                        Sig.                                                     .278

                 ix.   Assumption #9: There is no multicollinearity.
                       The existence of singularity and multicolinearity which create statistical problems to be
                       a concern can be detected at higher correlation matrix i.e. r=+.8 or r=+.9 and above
                       (Tabachnick & Fidell, 2013). Based on the correlations among the three test scores were
                       less than .8 and thus multicolinearity may not be a concern in this dataset.

               Table 6
               Correlations among the test scores

                                                           Post-test 2    Post-test 1    Pre-test
                                                                                             **
                                                                              **
                                  Pearson Correlation      1              .519           .437
                      Post-test 2  Sig. (2-tailed)                        .000           .001
                                  N                        56             56             56
                                                               **
                                                                                             **
                                  Pearson Correlation      .519           1              .713
                      Post-test 1  Sig. (2-tailed)         .000                          .000
                                  N                        56             56             56
                                                               **
                                                                              **
                                  Pearson Correlation      .437           .713           1
                      Pre-test    Sig. (2-tailed)          .001           .000
                                  N                        56             56             56
                      Note. **. Correlation is significant at the 0.01 level (2-tailed).


                                                           176
   180   181   182   183   184   185   186   187   188   189   190