
Page 183 - Jurnal Kurikulum BPK 2020
P. 183
ii. Assumption #2: The independent variable should consist of two or more categorical,
independent groups.
The independent variables met this criterion as I had three groups/cells namely, PBL-
online, PBL-book and non-treatment group.
iii. Assumption #3: There should be independence of observations when selecting
MANOVA analysis, which means that there is no relationship between the observations
in each group or between the groups themselves.
The students in each group are different and no student being in more than one group.
iv. Assumption #4: Adequate sample size is important for MANOVA but the larger sample
size, the better. It is advisable to have more cases in each group than the number of
dependent variables.
According to Kraemer & Thiemann (1987), 14 participants per cell, given at least three
cells and an effect size of .50, will yield power of approximately 80%. Since there were
more than 14 students in each group, the number of subjects may not be a concern in
performing MANOVA.
v. Assumption #5: There are no univariate or multivariate outliers.
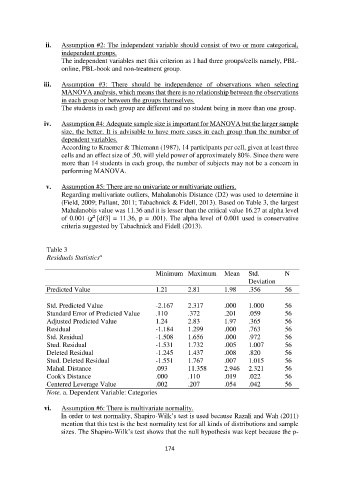
Regarding multivariate outliers, Mahalanobis Distance (D2) was used to determine it
(Field, 2009; Pallant, 2011; Tabachnick & Fidell, 2013). Based on Table 3, the largest
Mahalanobis value was 11.36 and it is lesser than the critical value 16.27 at alpha level
2
of 0.001 (χ [df3] = 11.36, p = .001). The alpha level of 0.001 used is conservative
criteria suggested by Tabachnick and Fidell (2013).
Table 3
Residuals Statistics a
Minimum Maximum Mean Std. N
Deviation
Predicted Value 1.21 2.81 1.98 .356 56
Std. Predicted Value -2.167 2.317 .000 1.000 56
Standard Error of Predicted Value .110 .372 .201 .059 56
Adjusted Predicted Value 1.24 2.83 1.97 .365 56
Residual -1.184 1.299 .000 .763 56
Std. Residual -1.508 1.656 .000 .972 56
Stud. Residual -1.531 1.732 .005 1.007 56
Deleted Residual -1.245 1.437 .008 .820 56
Stud. Deleted Residual -1.551 1.767 .007 1.015 56
Mahal. Distance .093 11.358 2.946 2.321 56
Cook's Distance .000 .110 .019 .022 56
Centered Leverage Value .002 .207 .054 .042 56
Note. a. Dependent Variable: Categories
vi. Assumption #6: There is multivariate normality.
In order to test normality, Shapiro-Wilk’s test is used because Razali and Wah (2011)
mention that this test is the best normality test for all kinds of distributions and sample
sizes. The Shapiro-Wilk’s test shows that the null hypothesis was kept because the p-
174