
Page 169 - Jurnal Kurikulum BPK 2020
P. 169
Black, Babin & Anderson, 2010). This resulted in 61,642 respondents acceptable as data (Table
1). A descriptive analysis was reported through the mean, min, max and standard deviation.
The mean intepretation was also reported. Table 4 presents the mean interpretation for this
study. An internal reliability testing using Cronbach Alpha was conducted to ensure consistent
measurement across the various items in the instrument and the items are ‘hang together as a
set’ (Segaran & Bougie, 2016).
Table 4
Mean Intepretation
Mean Value Interpretation
1.00 – 2.00 Low
2.01 – 3.00 Moderately Low
3.01 – 4.00 Moderately High
4.01 – 5.00 High
Nunnally, J.C. (1978)
RESULTS
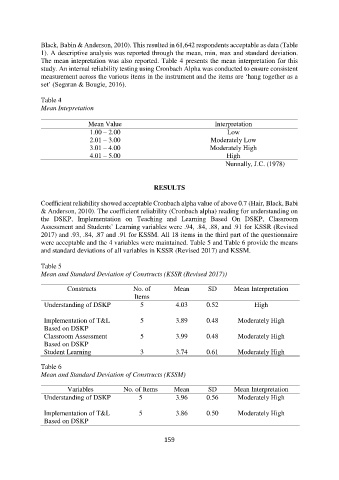
Coefficient reliability showed acceptable Cronbach alpha value of above 0.7 (Hair, Black, Babi
& Anderson, 2010). The coefficient reliability (Cronbach alpha) reading for understanding on
the DSKP, Implementation on Teaching and Learning Based On DSKP, Classroom
Assessment and Students’ Learning variables were .94, .84, .88, and .91 for KSSR (Revised
2017) and .93, .84, .87 and .91 for KSSM. All 18 items in the third part of the questionnaire
were acceptable and the 4 variables were maintained. Table 5 and Table 6 provide the means
and standard deviations of all variables in KSSR (Revised 2017) and KSSM.
Table 5
Mean and Standard Deviation of Constructs (KSSR (Revised 2017))
Constructs No. of Mean SD Mean Interpretation
Items
Understanding of DSKP 5 4.03 0.52 High
Implementation of T&L 5 3.89 0.48 Moderately High
Based on DSKP
Classroom Assessment 5 3.99 0.48 Moderately High
Based on DSKP
Student Learning 3 3.74 0.61 Moderately High
Table 6
Mean and Standard Deviation of Constructs (KSSM)
Variables No. of Items Mean SD Mean Interpretation
Understanding of DSKP 5 3.96 0.56 Moderately High
Implementation of T&L 5 3.86 0.50 Moderately High
Based on DSKP
159