
Page 157 - fbkCardioDiabetes_2017
P. 157
Cardio Diabetes Medicine 2017 133
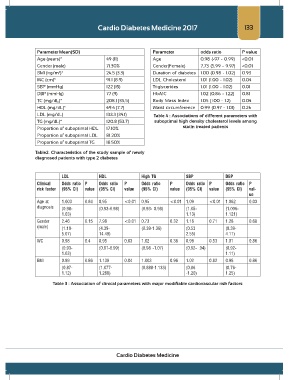
Parameter Mean(SD) Parameter odds ratio P value
Age (years)* 49 (11) Age 0.98 (-97 - 0.99) <0.01
Gender (male) 71.30% Gender(Female) 7.73 (5.99 - 9.97) <0.01
BMI (kg/m )* 24.5 (3.3) Duration of diabetes 1.00 (0.98 - 1.02) 0.93
2
WC (cm)* 91.1 (8.9) LDL Cholesterol 1.01 (1.00 - 1.02) 0.04
SBP (mmHg) 122 (15) Triglycerides 1.01 (1.00 - 1.02) 0.01
DBP (mmHg) 77 (9) HbA1C 1.02 (0.86 - 1.22) 0.81
TC (mg/dL)* 208.1 (35.5) Body Mass Index 1.05 (1.00 - 1.2) 0.04
HDL (mg/dL)* 49.4 (7.7) Waist circumference 0.99 (0.97 - 1.01) 0.26
LDL (mg/dL) 133.3 (34.1) Table 4 : Associations of different parameters with
TG (mg/dL)* 120.8 (53.7) suboptimal high density cholesterol levels among
Proportion of suboptimal HDL 17.10% statin treated patients
Proportion of suboptimal LDL 81.20%
Proportion of suboptimal TG 18.50%
Table2. Characteristics of the study sample of newly
diagnosed patients with type 2 diabetes
LDL HDL High TG SBP DBP
Clinical Odds ratio P Odds ratio P Odds ratio P Odds ratio P Odds ratio P
risk factor (95% CI) value (95% CI) value (95% CI) value (95% CI) value (95% CI) val-
ue
Age at 1.003 0.84 0.95 <0.01 0.95 <0.01 1.09 <0.01 1.062 0.03
diagnosis (0.98- (0.93-0.98) (0.93- 0.98) (1.05- (1.006-
1.03) 1.13) 1.121)
Gender 2.46 0.15 7.98 <0.01 0.73 0.32 1.16 0.71 1.28 0.68
(male) (1.19- (4.39- (0.39-1.36) (0.53 (0.39-
5.07) 14.49) 2.55) 4.11)
WC 0.98 0.4 0.95 0.03 1.02 0.36 0.98 0.53 1.01 0.86
(0.93- (0.91-0.99) (0.98 -1.07) (0.92- .04) (0.92-
1.03) 1.11)
BMI 0.99 0.86 1.139 0.04 1.003 0.96 1.02 0.82 0.98 0.86
(0.87- (1.077- (0.888-1.133) (0.86 (0.76-
1.12) 1.288) -1.20) 1.25)
Table 3 : Association of clinical parameters with major modifiable cardiovascular risk factors
Cardio Diabetes Medicine