
Page 429 - fbkCardioDiabetes_2017
P. 429
Cardio Diabetes Medicine 2017 405
Demographics Sulphonylureas (n= 154) DPP4- inhibitors (n=153) GLP-1 agonists (n=115) SGLT-2 inhibitors (n=90)
Gliclazide Glimepiride Sitagliptin Linagliptin Exenatide Liraglutide Dapagliflozin (n=90)
(n=141) (n=13) (n=128) (n=25) (n=47) (n=68)
Age 57.6 53.2 59 66 58.2 68 59.17
Men 46.8% 53.8% 52.3% 44% 48.9% 64.7% 58.9%
Women 53.2% 46.2% 47.7% 66% 51.1% 35.3% 41.1%
HbA1c mmol/mol 77.2 77.8 76.2 76.5 73.7 76.6 79.2
Weight (Kg) 82.9 88.9 86.2 89.1 100.8 101.9 97.6
BMI 28.5 30.2 29.3 30.7 34.5 34 32.9
Table 1. Baseline information for patients prior to addition of new therapies.
Outcome Time (Mo) Sulphonylureas DPP4 inhibitors GLP-1 agonists SLGT-2 inhibitors
measure (n = 154) (n=153) (n=115)
Gliclazide Glimepiride Sitagliptin Linagliptin Exenatide Liraglutide Dapagliflozin
(n= 141) (n=13) (n=128) (n=25) (n=47) (n=68) (n=90)
HbA1c 0 77.27 77.78 76.18 76.52 73.72 76.59 71.18
(mmol/mol) 3 -9.48 * -9.85 * -6.59 * -6.48 * -7.32 * -10.28 * -8.97 *
12 -10.57 * -6.62 * -7.72 * -7.4 * -4.62 * -10.10 * -11.54 *
Weight (kg) 0 82.99 88.7 86.15 89.1 100.8 101.95 97.58
3 + 0.13 + 0.34 -0.47 * -0.83 * -2.57 * -1.71 * -1.96 *
12 + 0.37 * + 0.02 -1.12 * -0.95 ** -3.46 * -2.47 * -2.73 **
Table 2: Changes in HbA1c and weight at 3 and 12 months after initiation of additional therapies (* Significant difference
from baseline value , and ** Significant difference from baseline and between 3 and 12 months p<0.01)
tenders, with whom the Physician reviewing the pa-
tient prescribed what they felt was the most logical
therapy on an individual basis. Comparisons between
this study and pharmaceutical trial data, where there
may be a more careful selection of the cohort in-
volved, and different study lengths, should therefore
be done with caution.
Agents felt to reduce weight more from clinical trial
data, such as the GLP-1 agonists and SGLT-2 inhib-
itors, appear to have been given to patients with a
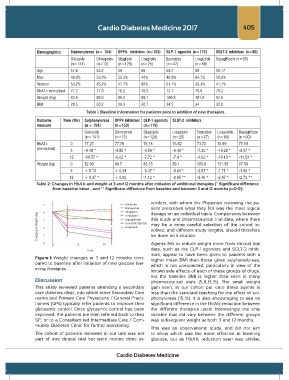
Figure 1: Weight changes at 3 and 12 months com- higher mean BMI than those given sulphonylureas,
pared to baseline after initiation of new glucose low- which is not unexpected, particularly in view of the
ering therapies
known side effects of each of these groups of drugs,
but the baseline BMI is higher than seen in many
Discussion pharmaceutical trials (5,11,13,15). The small weight
This study reviewed patients attending a secondary gain seen, in our cohort put onto these agents is
care diabetes clinic, into which other Secondary Care less than the standard teaching for the effect of sul-
teams and Primary Care Physicians / General Practi- phonylureas (15,16). It is also encouraging to see no
tioners (GPs) typically refer patients to improve their significant difference in the HbA1c reduction between
glycaemic control. Once glycaemic control has been the different therapies used. Interestingly the only
improved, the patients are then referred back to their variable that did vary between the different groups
GP, or to a Consultant led Intermediate Care / Com- was subsequent weight at both 3 and 12 months.
munity Diabetes Clinic for further monitoring.
This was an observational study, and did not aim
The cohort of patients reviewed in our unit was not to show which was the more effective at lowering
part of any clinical trial but were routine clinic at- glucose, but as HbA1c reduction seen was similar,
Cardio Diabetes Medicine