
Page 127 - 2018 Comprehensive Annual Financial Report - City of Winston-Salem
P. 127
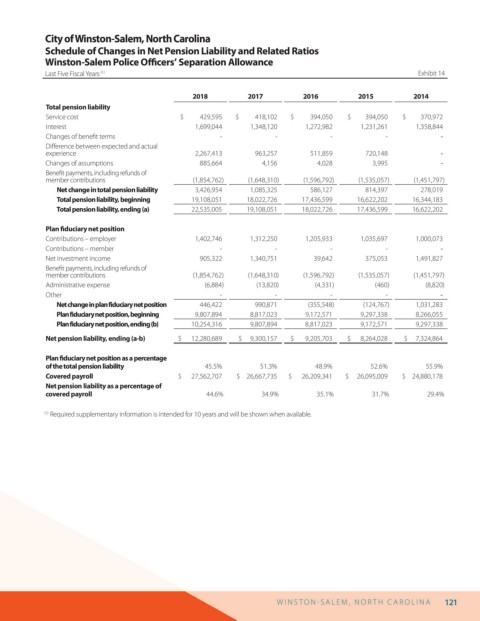
City of Winston-Salem, North Carolina

                  Schedule of Changes in Net Pension Liability and Related Ratios
                  Winston-Salem Police O cers’ Separation Allowance

                  Last Five Fiscal Years  (1)                                                                    Exhibit 14

                                                        2018          2017          2016          2015          2014
                  Total pension liability
                  Service cost                       $          429,595  $          418,102   $          394,050   $         394,050   $         370,972
                  Interest                              1,699,044      1,348,120     1,272,982     1,231,261     1,358,844
                  Changes of bene t terms                      -             -             -             -             -
                  Di erence between expected and actual
                  experience                            2,267,413       963,257       511,859       720,148            -
                   Changes of assumptions                 885,664         4,156         4,028         3,995            -
                  Bene t payments, including refunds of
                  member contributions                  (1,854,762)   (1,648,310)   (1,596,792)   (1,535,057)   (1,451,797)
                     Net change in total pension liability  3,426,954  1,085,325      586,127       814,397       278,019
                     Total pension liability, beginning  19,108,051   18,022,726    17,436,599    16,622,202    16,344,183
                     Total pension liability, ending (a)  22,535,005  19,108,051    18,022,726    17,436,599    16,622,202

                  Plan  duciary net position
                  Contributions – employer              1,402,746      1,312,250     1,205,933     1,035,697     1,000,073
                  Contributions – member                       -             -             -             -             -
                  Net investment income                   905,322      1,340,751       39,642       375,053      1,491,827
                  Bene t payments, including refunds of
                  member contributions                  (1,854,762)   (1,648,310)   (1,596,792)   (1,535,057)   (1,451,797)
                  Administrative expense                   (6,884)      (13,820)        (4,331)       (460)        (8,820)
                  Other                                        -             -             -             -             -
                     Net change in plan fiduciary net position  446,422  990,871     (355,548)     (124,767)     1,031,283
                     Plan fiduciary net position, beginning  9,807,894  8,817,023    9,172,571     9,297,338     8,266,055
                     Plan fiduciary net position, ending (b)  10,254,316  9,807,894  8,817,023     9,172,571     9,297,338

                  Net pension liability, ending (a-b)  $      12,280,689  $     9,300,157  $       9,205,703  $      8,264,028  $     7,324,864

                  Plan  duciary net position as a percentage
                  of the total pension liability           45.5%         51.3%         48.9%         52.6%         55.9%
                  Covered payroll                   $      27,562,707  $    26,667,735  $      26,209,341  $     26,095,009  $    24,880,178
                  Net pension liability as a percentage of
                  covered payroll                          44.6%         34.9%          35.1%         31.7%         29.4%

                    Required supplementary information is intended for 10 years and will be shown when available.
                  (1)


                                                                             W I N S T O N   S AL E M ,  N O R T H  C AR O L I N A  121