Page 218 - 2018 Comprehensive Annual Financial Report - City of Winston-Salem
P. 218

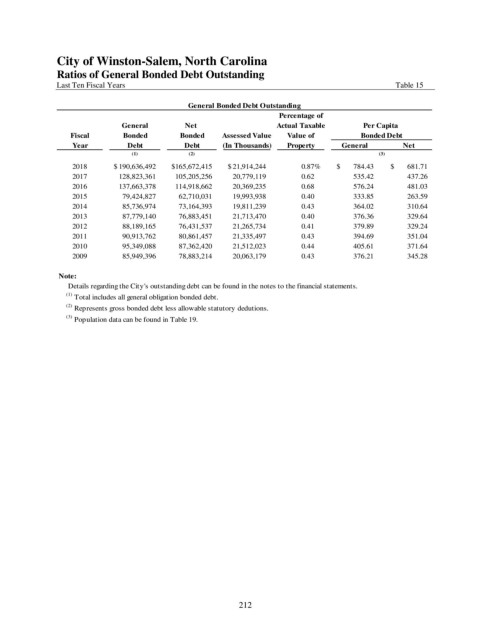
City of Winston-Salem, North Carolina
               Ratios of General Bonded Debt Outstanding

               Last Ten Fiscal Years                                                                  Table 15

                                                 General Bonded Debt Outstanding
                                                                        Percentage of
                                General         Net                     Actual Taxable        Per Capita
                   Fiscal       Bonded         Bonded     Assessed Value  Value of           Bonded Debt
                   Year          Debt           Debt      (In Thousands)  Property      General         Net
                                   (1)           (2)                                              (3)
                   2018       $  190,636,492  $  165,672,415  $  21,914,244   0.87%    $         784.43  $         681.71
                   2017           128,823,361      105,205,256      20,779,119  0.62              535.42             437.26
                   2016           137,663,378      114,918,662      20,369,235  0.68              576.24             481.03
                   2015             79,424,827        62,710,031      19,993,938  0.40             333.85             263.59
                   2014             85,736,974        73,164,393      19,811,239  0.43             364.02             310.64
                   2013             87,779,140        76,883,451      21,713,470  0.40             376.36             329.64
                   2012             88,189,165        76,431,537      21,265,734  0.41             379.89             329.24
                   2011             90,913,762        80,861,457      21,335,497  0.43             394.69             351.04
                   2010             95,349,088        87,362,420      21,512,023  0.44             405.61             371.64
                   2009             85,949,396        78,883,214      20,063,179  0.43             376.21             345.28

                Note:
                     Details regarding the City's outstanding debt can be found in the notes to the financial statements.
                  (1)
                    Total includes all general obligation bonded debt.
                  (2)  Represents gross bonded debt less allowable statutory dedutions.
                  (3)  Population data can be found in Table 19.


                                                              212
   213   214   215   216   217   218   219   220   221   222   223