Page 222 - 2018 Comprehensive Annual Financial Report - City of Winston-Salem
P. 222

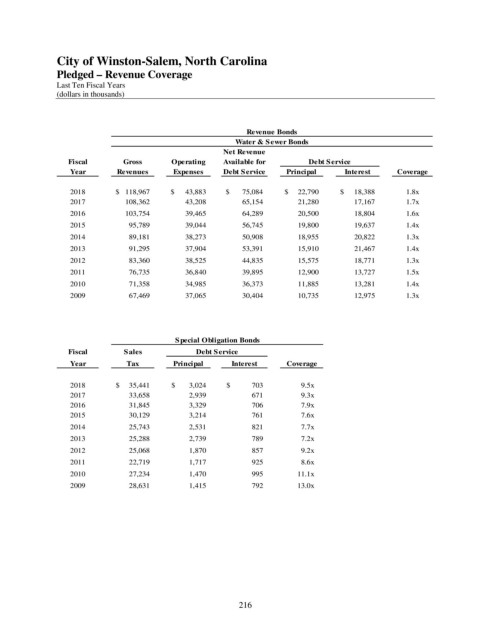
City of Winston-Salem, North Carolina
               Pledged – Revenue Coverage

               Last Ten Fiscal Years
               (dollars in thousands)


                                                                Revenue Bonds
                                                             Water & Sewer Bonds
                                                          Net Revenue
                  Fiscal        Gross        Operating    Available for         Debt Service
                   Year        Revenues      Expenses     Debt Service    Principal      Interest     Coverage


                   2018       $     118,967  $       43,883  $        75,084  $       22,790  $       18,388  1.8x
                   2017              108,362           43,208            65,154           21,280           17,167  1.7x
                   2016              103,754           39,465            64,289           20,500           18,804  1.6x
                   2015                95,789           39,044            56,745           19,800           19,637  1.4x
                   2014                89,181           38,273            50,908           18,955           20,822  1.3x
                   2013                91,295           37,904            53,391           15,910           21,467  1.4x
                   2012                83,360           38,525            44,835           15,575           18,771  1.3x
                   2011                76,735           36,840            39,895           12,900           13,727  1.5x
                   2010                71,358           34,985            36,373           11,885           13,281  1.4x
                   2009                67,469           37,065            30,404           10,735           12,975  1.3x


                                              Special Obligation Bonds
                  Fiscal         Sales             Debt Service
                   Year          Tax         Principal      Interest      Coverage


                   2018       $       35,441  $         3,024  $             703  9.5x
                   2017                33,658             2,939                 671  9.3x
                   2016                31,845             3,329                 706  7.9x
                   2015                30,129             3,214                 761  7.6x
                   2014                25,743             2,531                 821  7.7x
                   2013                25,288             2,739                 789  7.2x
                   2012                25,068             1,870                 857  9.2x
                   2011                22,719             1,717                 925  8.6x
                   2010                27,234             1,470                 995  11.1x
                   2009                28,631             1,415                 792  13.0x


                                                              216
   217   218   219   220   221   222   223   224   225   226   227