
Page 227 - 2018 Comprehensive Annual Financial Report - City of Winston-Salem
P. 227
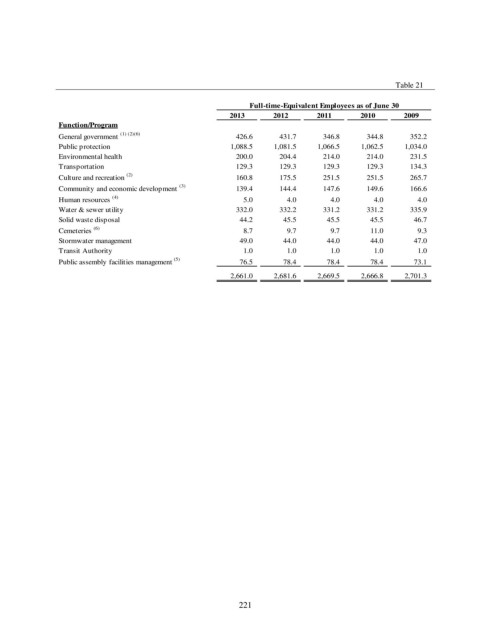
Table 21

                                                                 Full-time-Equivalent Employees as of June 30
                                                            2013       2012       2011       2010       2009
                Function/Program
                General government  (1) (2)(6)                     426.6            431.7            346.8            344.8            352.2
                Public protection                               1,088.5         1,081.5         1,066.5         1,062.5         1,034.0
                Environmental health                               200.0            204.4            214.0            214.0            231.5
                Transportation                                     129.3            129.3            129.3            129.3            134.3
                Culture and recreation  (2)                        160.8            175.5            251.5            251.5            265.7
                Community and economic development  (3)             139.4            144.4            147.6            149.6            166.6
                Human resources  (4)                                   5.0                4.0                4.0                4.0                4.0
                Water & sewer utility                              332.0            332.2            331.2            331.2            335.9
                Solid waste disposal                                 44.2              45.5              45.5              45.5              46.7
                Cemeteries  (6)                                        8.7                9.7                9.7              11.0                9.3
                Stormwater management                                49.0              44.0              44.0              44.0              47.0
                Transit Authority                                      1.0                1.0                1.0                1.0                1.0
                Public assembly facilities management  (5)              76.5              78.4              78.4              78.4              73.1
                                                                2,661.0         2,681.6         2,669.5         2,666.8         2,701.3


                                                              221