Page 64 - 2018 Comprehensive Annual Financial Report - City of Winston-Salem
P. 64

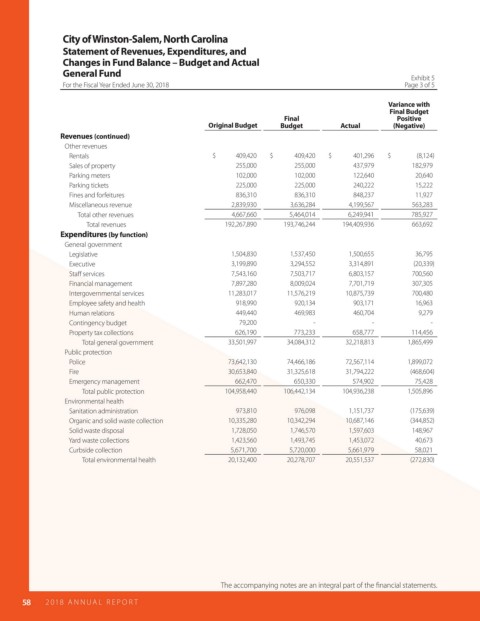
City of Winston-Salem, North Carolina
                       Statement of Revenues, Expenditures, and
                       Changes in Fund Balance – Budget and Actual
                       General Fund                                                                             Exhibit 5
                       For the Fiscal Year Ended June 30, 2018                                                Page 3 of 5


                                                                                                          Variance with
                                                                                                          Final Budget
                                                                               Final                        Positive
                                                            Original Budget   Budget          Actual       (Negative)
                      Revenues (continued)
                         Other revenues
                            Rentals                          $              409,420  $               409,420  $               401,296  $                  (8,124)
                            Sales of property                      255,000        255,000        437,979        182,979
                            Parking meters                         102,000        102,000        122,640         20,640
                            Parking tickets                        225,000        225,000        240,222         15,222
                            Fines and forfeitures                  836,310        836,310        848,237         11,927
                            Miscellaneous revenue                 2,839,930      3,636,284      4,199,567       563,283
                                  Total other revenues            4,667,660      5,464,014      6,249,941       785,927
                                        Total revenues          192,267,890    193,746,244    194,409,936       663,692
                      Expenditures (by function)
                         General government
                            Legislative                           1,504,830      1,537,450      1,500,655        36,795
                            Executive                             3,199,890      3,294,552      3,314,891       (20,339)
                            Sta  services                         7,543,160      7,503,717      6,803,157       700,560
                            Financial management                  7,897,280      8,009,024      7,701,719       307,305
                            Intergovernmental services           11,283,017     11,576,219     10,875,739       700,480
                            Employee safety and health             918,990        920,134        903,171         16,963
                            Human relations                        449,440        469,983        460,704          9,279
                            Contingency budget                      79,200             -              -              -
                            Property tax collections               626,190        773,233        658,777        114,456
                                     Total general government    33,501,997     34,084,312     32,218,813      1,865,499
                         Public protection
                            Police                               73,642,130     74,466,186     72,567,114      1,899,072
                            Fire                                 30,653,840     31,325,618     31,794,222      (468,604)
                            Emergency management                   662,470        650,330        574,902         75,428
                                     Total public protection    104,958,440    106,442,134    104,936,238      1,505,896
                         Environmental health
                            Sanitation administration              973,810        976,098       1,151,737      (175,639)
                            Organic and solid waste collection   10,335,280     10,342,294     10,687,146      (344,852)
                            Solid waste disposal                  1,728,050      1,746,570      1,597,603       148,967
                            Yard waste collections                1,423,560      1,493,745      1,453,072        40,673
                            Curbside collection                   5,671,700      5,720,000      5,661,979        58,021
                                     Total environmental health  20,132,400     20,278,707     20,551,537      (272,830)


                                                               The accompanying notes are an integral part of the  nancial statements.

            58    2018  AN NUAL  R E P O R T
   59   60   61   62   63   64   65   66   67   68   69