
Page 69 - 2018 Comprehensive Annual Financial Report - City of Winston-Salem
P. 69
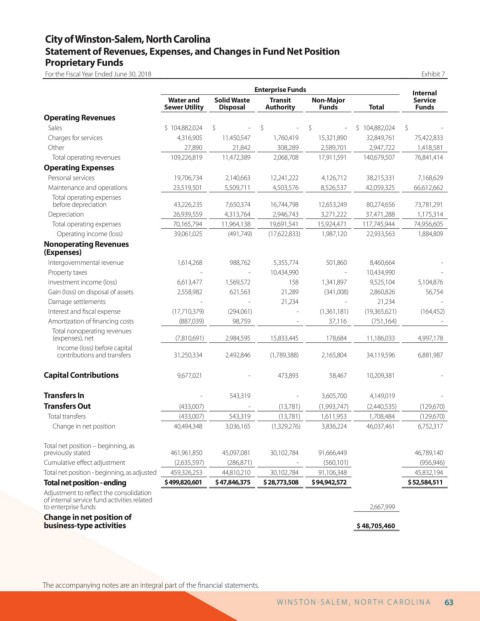
City of Winston-Salem, North Carolina
                  Statement of Revenues, Expenses, and Changes in Fund Net Position
                  Proprietary Funds

                  For the Fiscal Year Ended June 30, 2018                                                         Exhibit 7
                                                                        Enterprise Funds                        Internal
                                                  Water and   Solid Waste   Transit   Non-Major                 Service
                                                 Sewer Utility  Disposal  Authority     Funds        Total       Funds
                  Operating Revenues
                     Sales                       $  104,882,024   $                       -  $                       -  $                       -  $   104,882,024   $                       -
                     Charges for services           4,316,905   11,450,547   1,760,419   15,321,890   32,849,761   75,422,833
                     Other                            27,890      21,842     308,289     2,589,701   2,947,722   1,418,581
                        Total operating revenues  109,226,819   11,472,389   2,068,708   17,911,591   140,679,507   76,841,414
                  Operating Expenses
                     Personal services             19,706,734   2,140,663   12,241,222   4,126,712   38,215,331   7,168,629
                     Maintenance and operations    23,519,501   5,509,711   4,503,576    8,526,537   42,059,325   66,612,662
                        Total operating expenses
                        before depreciation        43,226,235   7,650,374   16,744,798   12,653,249   80,274,656   73,781,291
                     Depreciation                  26,939,559   4,313,764   2,946,743    3,271,222   37,471,288   1,175,314
                        Total operating expenses   70,165,794   11,964,138   19,691,541   15,924,471   117,745,944   74,956,605
                           Operating income (loss)  39,061,025   (491,749)  (17,622,833)  1,987,120   22,933,563   1,884,809
                  Nonoperating Revenues
                  (Expenses)
                     Intergovernmental revenue      1,614,268    988,762    5,355,774     501,860    8,460,664         -
                     Property taxes                       -           -     10,434,990         -    10,434,990         -
                     Investment income (loss)       6,613,477   1,569,572       158      1,341,897   9,525,104   5,104,876
                     Gain (loss) on disposal of assets  2,558,982   621,563   21,289     (341,008)   2,860,826     56,754
                     Damage settlements                   -           -       21,234           -       21,234          -
                     Interest and  scal expense    (17,710,379)  (294,061)        -     (1,361,181)  (19,365,621)  (164,452)
                     Amortization of  nancing costs  (887,039)    98,759          -        37,116     (751,164)        -
                        Total nonoperating revenues
                        (expenses), net            (7,810,691)  2,984,595   15,833,445    178,684   11,186,033   4,997,178
                           Income (loss) before capital
                           contributions and transfers  31,250,334  2,492,846  (1,789,388)  2,165,804  34,119,596  6,881,987
                  Capital Contributions             9,677,021         -       473,893      58,467   10,209,381         -


                  Transfers In                            -      543,319          -      3,605,700   4,149,019         -
                  Transfers Out                     (433,007)         -       (13,781)  (1,993,747)  (2,440,535)  (129,670)
                     Total transfers                (433,007)    543,319      (13,781)   1,611,953   1,708,484    (129,670)
                        Change in net position     40,494,348   3,036,165   (1,329,276)  3,836,224   46,037,461   6,752,317

                  Total net position – beginning, as
                  previously stated               461,961,850   45,097,081   30,102,784  91,666,449              46,789,140
                  Cumulative e ect adjustment      (2,635,597)   (286,871)        -      (560,101)                (956,946)
                  Total net position - beginning, as adjusted  459,326,253   44,810,210   30,102,784   91,106,348   45,832,194
                  Total net position - ending    $ 499,820,601   $ 47,846,375   $ 28,773,508   $ 94,942,572    $ 52,584,511
                  Adjustment to re ect the consolidation
                  of internal service fund activities related
                  to enterprise funds                                                                2,667,999
                  Change in net position of
                  business-type activities                                                        $ 48,705,460


                 The accompanying notes are an integral part of the  nancial statements.

                                                                             W I N S T O N   S AL E M ,  N O R T H  C AR O L I N A  63