
Page 71 - 2018 Comprehensive Annual Financial Report - City of Winston-Salem
P. 71
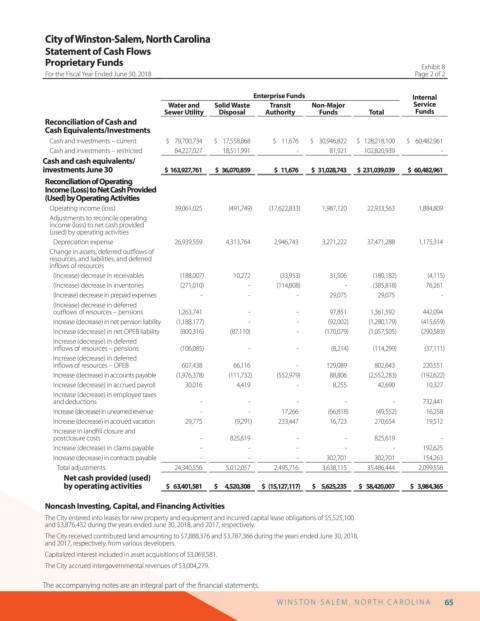
City of Winston-Salem, North Carolina
                  Statement of Cash Flows
                  Proprietary Funds                                                                               Exhibit 8

                  For the Fiscal Year Ended June 30, 2018                                                        Page 2 of 2

                                                                       Enterprise Funds                         Internal
                                                  Water and   Solid Waste   Transit   Non-Major                 Service
                                                 Sewer Utility  Disposal  Authority     Funds        Total       Funds
                  Reconciliation of Cash and
                  Cash Equivalents/Investments
                   Cash and investments – current  $    79,700,734   $    17,558,868   $    11,676   $    30,946,822   $   128,218,100   $    60,482,961
                   Cash and investments – restricted  84,227,027   18,511,991     -        81,921   102,820,939        -
                  Cash and cash equivalents/
                  investments June 30            $   163,927,761   $    36,070,859   $    11,676   $    31,028,743   $   231,039,039   $    60,482,961
                  Reconciliation of Operating
                  Income (Loss) to Net Cash Provided
                  (Used) by Operating Activities
                   Operating income (loss)         39,061,025    (491,749)  (17,622,833)  1,987,120  22,933,563  1,884,809
                   Adjustments to reconcile operating
                   income (loss) to net cash provided
                   (used) by operating activities
                    Depreciation expense           26,939,559   4,313,764    2,946,743   3,271,222  37,471,288   1,175,314
                   Change in assets, deferred out ows of
                   resources, and liabilities, and deferred
                   in ows of resources
                    (Increase) decrease in receivables  (188,007)  10,272     (33,953)     31,506     (180,182)     (4,115)
                    (Increase) decrease in inventories  (271,010)     -      (114,808)         -      (385,818)    76,261
                    (Increase) decrease in prepaid expenses  -        -           -        29,075      29,075          -
                    (Increase) decrease in deferred
                    out ows of resources – pensions  1,263,741        -           -        97,851    1,361,592     442,094
                    Increase (decrease) in net pension liability  (1,188,177)  -  -       (92,002)   (1,280,179)  (415,659)
                    Increase (decrease) in net OPEB liability  (800,316)  (87,110)  -     (170,079)  (1,057,505)  (290,583)
                    Increase (decrease) in deferred
                    in ows of resources – pensions   (106,085)        -           -        (8,214)    (114,299)    (37,111)
                    Increase (decrease) in deferred
                    in ows of resources – OPEB       607,438      66,116          -       129,089     802,643      220,551
                    Increase (decrease) in accounts payable  (1,976,378)  (111,732)  (552,979)  88,806   (2,552,283)  (192,622)
                    Increase (decrease) in accrued payroll  30,016   4,419        -         8,255      42,690      10,327
                    Increase (decrease) in employee taxes
                    and deductions                        -           -           -            -           -       732,441
                    Increase (decrease) in unearned revenue  -        -       17,266      (66,818)     (49,552)    16,258
                    Increase (decrease) in accrued vacation  29,775   (9,291)  233,447     16,723     270,654      19,512
                    Increase in land ll closure and
                    postclosure costs                     -      825,619          -            -      825,619          -
                    Increase (decrease) in claims payable  -          -           -            -           -       192,625
                    Increase (decrease) in contracts payable  -       -           -       302,701     302,701      154,263
                     Total adjustments             24,340,556   5,012,057    2,495,716   3,638,115   35,486,444  2,099,556
                       Net cash provided (used)
                       by operating activities   $     63,401,581  $         4,520,308  $    (15,127,117)  $       5,625,235  $     58,420,007  $     3,984,365

                  Noncash Investing, Capital, and Financing Activities

                  The City entered into leases for new property and equipment and incurred capital lease obligations of $5,525,100
                  and $3,876,432 during the years ended June 30, 2018, and 2017, respectively.
                  The City received contributed land amounting to $7,888,376 and $3,787,366 during the years ended June 30, 2018,
                  and 2017, respectively, from various developers.
                  Capitalized interest included in asset acquisitions of $3,069,581.
                  The City accrued intergovernmental revenues of $3,004,279.

                 The accompanying notes are an integral part of the  nancial statements.

                                                                             W I N S T O N   S AL E M ,  N O R T H  C AR O L I N A  65