
Page 115 - Critical Care Nursing Demystified
P. 115
100 CRITICAL CARE NURSING DeMYSTIFIED
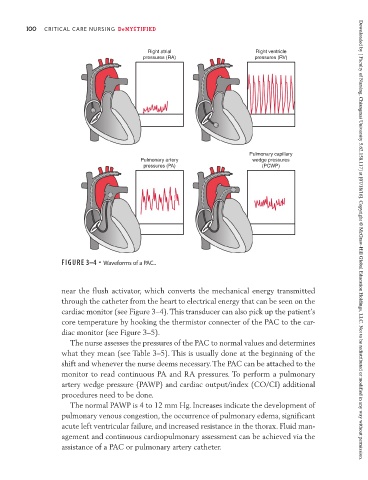
Right atrial Right ventricle
pressures (RA) pressures (RV)
Pulmonary capillary
Pulmonary artery wedge pressures
pressures (PA) (PCWP)
FIGURE 3–4 • Waveforms of a PAC.. Downloaded by [ Faculty of Nursing, Chiangmai University 5.62.158.117] at [07/18/16]. Copyright © McGraw-Hill Global Education Holdings, LLC. Not to be redistributed or modified in any way without permission.
near the flush activator, which converts the mechanical energy transmitted
through the catheter from the heart to electrical energy that can be seen on the
cardiac monitor (see Figure 3–4). This transducer can also pick up the patient’s
core temperature by hooking the thermistor connecter of the PAC to the car-
diac monitor (see Figure 3–5).
The nurse assesses the pressures of the PAC to normal values and determines
what they mean (see Table 3–5). This is usually done at the beginning of the
shift and whenever the nurse deems necessary. The PAC can be attached to the
monitor to read continuous PA and RA pressures. To perform a pulmonary
artery wedge pressure (PAWP) and cardiac output/index (CO/CI) additional
procedures need to be done.
The normal PAWP is 4 to 12 mm Hg. Increases indicate the development of
pulmonary venous congestion, the occurrence of pulmonary edema, significant
acute left ventricular failure, and increased resistance in the thorax. Fluid man-
agement and continuous cardiopulmonary assessment can be achieved via the
assistance of a PAC or pulmonary artery catheter.