
Page 216 - Color_Atlas_of_Physiology_5th_Ed._-_A._Despopoulos_2003
P. 216
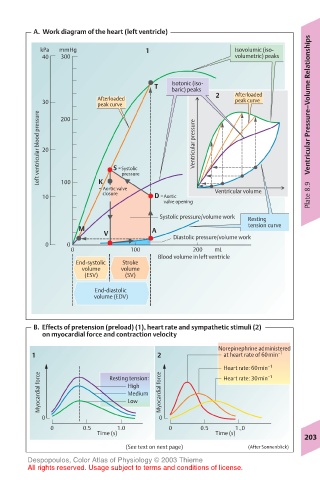
A.  Work diagram of the heart (left ventricle)
          kPa  mmHg               1                   Isovolumic (iso-
           40  300                                    volumetric) peaks


                                    T   Isotonic (iso-
                                        baric) peaks
                                                      peak curve
           30  200     Afterloaded                2   Afterloaded      Ventricular Pressure–Volume Relationships
                       peak curve
          Left ventricular blood pressure  20  S =Systolic  Ventricular pressure


                                   pressure
                       K
               100
                       = Aortic valve            Ventricular volume
           10              closure  D =Aortic                          Plate 8.9
                                             valve opening
                                     Systolic pressure/volume work  Resting
                   M               A                     tension curve
                        V               Diastolic pressure/volume work
           0    0
                 0            100           200  mL
                                     Blood volume in left ventricle
                  End-systolic  Stroke
                   volume   volume
                    (ESV)    (SV)
                      End-diastolic
                      volume (EDV)


         B.  Effects of pretension (preload) (1), heart rate and sympathetic stimuli (2)
               on myocardial force and contraction velocity
                                                  Norepinephrine administered
        1                           2                 at heart rate of 60min –1
                                                   Heart rate: 60min –1
          Myocardial force    High   Myocardial force
                                                             –1
                          Resting tension:
                                                   Heart rate: 30min
                              Medium
                              Low
          0                          0
            0       0.5    1.0         0      0.5     1.,0
                       Time (s)                  Time (s)
                                                                      203
                             (See text on next page)     (After Sonnenblick)
       Despopoulos, Color Atlas of Physiology © 2003 Thieme
       All rights reserved. Usage subject to terms and conditions of license.