Page 212 - Color_Atlas_of_Physiology_5th_Ed._-_A._Despopoulos_2003
P. 212

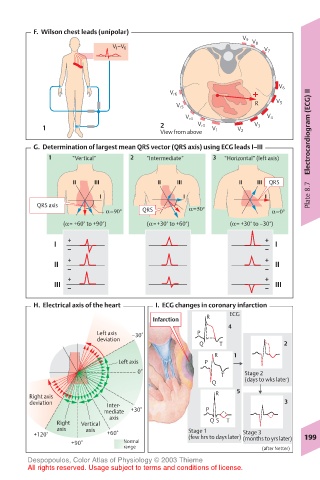
F.  Wilson chest leads (unipolar)
                                                        V 9
                                                          V 8
                          V 1 –V 6
                                                            V 7


                                                                V 6
                                                                       II
                                       V r6
                                                          R    V 5
                                         V r5
                                           V r4              V 4
           1                         2        V r3  V 1   V 3
                                     View from above  V 2              Electrocardiogram (ECG)
         G.  Determination of largest mean QRS vector (QRS axis) using ECG leads I–III
            1    “Vertical”   2   “Intermediate”  3  “Horizontal” (left axis)

                 II   III           II   III           II  III  QRS
                       I                  I                  I         Plate 8.7
         QRS axis
                         α=90°   QRS        α=50°             α=0°
               (α= +60° to +90°)  (α=+30° to +60°)   (α= +30° to –30°)
                +                                            +
             I                                                 I
                –                                            –
                +                                            +
             II                                                II
                –                                            –
                +                                            +
             III                                               III
                –                                            –
         H.  Electrical axis of the heart  I.  ECG changes in coronary infarction
                                   Infarction  R     ECG
                                                    4
                       Left axis  –30°       P
                       deviation
                                              Q   T              2
                                                 R    1
                            Left axis          P
                                0°                      Stage 2
                                                   T
                                                 Q      (days to wks later)
                                                  R   5
        Right axis
        deviation        Inter-                                  3
                        mediate  +30°          P
                          axis
              Right  Vertical                   Q S  T
              axis  axis                   Stage 1
         +120°           +60°              (few hrs to days later)  Stage 3  199
                                                        (months to yrs later)
                 +90°        Normal
                             range                          (after Netter)
       Despopoulos, Color Atlas of Physiology © 2003 Thieme
       All rights reserved. Usage subject to terms and conditions of license.
   207   208   209   210   211   212   213   214   215   216   217