
Page 296 - Color_Atlas_of_Physiology_5th_Ed._-_A._Despopoulos_2003
P. 296
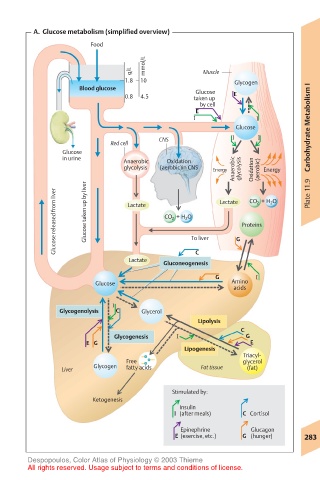
A.  Glucose metabolism (simplified overview)
                     Food
                                  mmol/L
                              g/L              Muscle
                             1.8  10                  Glycogen
                   Blood glucose             Glucose
                             0.8  4.5        taken up  E
                                              by cell
                                             E
                                             Ι             Ι
                                                      Glucose          Carbohydrate Metabolism I
                                     CNS             Ι     Ι
                          Red cell
               Glucose
               in urine      Anaerobic  Oxidation
                             glycolysis  (aerobic)in CNS  Energy  Anaerobic  glycolysis  Oxidation  (aerobic)  Energy  Plate 11.9

             Glucose released from liver  Glucose taken up by liver  Lactate  CO 2 +  H 2 O To liver  Lactate G  Proteins  H 2 O
                                                         CO 2 +


                                             C
                              Lactate  Gluconeogenesis
                                                 G         Ι
                      Glucose                        Amino
                                                      acids
                          Ι
              Glycogenolysis  C  Glycerol
                                              Lipolysis
                                                       C
                           Glycogenesis  Ι              G
                    E G                                  E
                                           Lipogenesis
                                                        Triacyl-
                             Free                       glycerol
                      Glycogen  fatty acids   Fat tissue
               Liver                                     (fat)
                                        Stimulated by:
                      Ketogenesis
                                         Insulin
                                        Ι  (after meals)  C  Cortisol
                                          Epinephrine    Glucagon
                                        E  (exercise, etc.)  G  (hunger)  283

       Despopoulos, Color Atlas of Physiology © 2003 Thieme
       All rights reserved. Usage subject to terms and conditions of license.