
Page 27 - Hall et al (2015) Principles of Critical Care-McGraw-Hill
P. 27
xxvi Introduction
chug-chug sound of her laboring ventilator came the still small voice 700
“less circulating volume, more dobutamine, less ventilation, less PEEP.” V F = CO(Ca – Cv )
Recognizing each as plausible interventions not tried together yet in 600 O 2 O 2 O 2
her management, we began. First we cut the tidal volume in half to a 500 V O 2 G = VE(Fl – Fe )
O 2
O 2
volume more appropriate to her size and acute lung disease, and reduced
the ventilator rate to 12 breaths/min. Immediately, the auto-PEEP fell V O 2 400
from 8 to 0 cm H O and her blood pressure (BP) increased without 300
2
.
much increase in Pa CO 2 200
Then we removed four units of blood from her indwelling arterial
line. As her BP decreased, we increased dobutamine from 2 to 12 µg/ 100
kg per minute, and PAOP decreased to 4 cm H O. Her urine output
2
increased to 80 mL/h. Then we progressively decreased PEEP in small 0 1200 2400
decrements to 8 cm H O overnight. By dawn, her cardiopulmonary D O 2 (mL/min = CO x Ca )
2
status was nearly normal. O 2
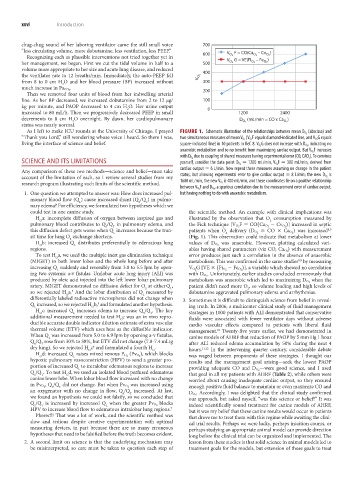
As I left to make ICU rounds at the University of Chicago, I prayed FIGURE 1. Schematic illustration of the relationships between mean D O 2 (abscissa) and
“Thank you Lord,” still wondering whose voice I heard. So there I was, two simultaneous measures of mean V O 2 (V O 2 F equals diamond-indicated line, and V O 2 G equals
living the interface of science and belief. square-indicated line) in 10 patients in Ref. 8. V O 2 G does not increase with D O 2 , indicating no
F increases
anaerobic metabolism and so no benefit from maximizing cardiac output. But V O 2
due to coupling of shared measures having experimental error (CO, CAO ). To convince
with D O 2 2
SCIENCE AND ITS LIMITATIONS yourself, consider the data point D O 2 = 1200 mL/min, V O 2 F = 300 mL/min, derived from
cardiac output = 6 L/min. Now repeat these measures assuming no change in the patient
Any comparison of these two methods—science and belief—must take is
account of the limitation of each, so I review several studies from my status, but allowing experimental error to give cardiac output = 8 L/min; the new D O 2
is 400 mL/min, and these coordinates lie on a positive relationship
research program illustrating such limits of the scientific method. 1600 mL/min, the new V O 2
between V O 2 F and D O 2 , a spurious correlation due to the measurement error of cardiac output,
1. One question we attempted to answer was: How does increased pul- but having nothing to do with anaerobic metabolism.
monary blood flow (Q ) cause increased shunt (Q /Q ) in pulmo-
L
T
S
nary edema? For efficiency, we formulated two hypotheses which we
could test in one canine study. the scientific method. An example with clinical implications was
H a: incomplete diffusion of oxygen between inspired gas and illustrated by the observation that O consumption measured by
O
2
pulmonary blood contributes to Q /Q in pulmonary edema, and the Fick technique [V O 2 F = CO(Ca O 2 − Cv O 2 )] increased in septic
S
T
this diffusion defect gets worse when Q increases because the tran- patients when O delivery (D O 2 = CO × Ca O 2 ) was increased
8,9
L
2
sit time for lung O exchange shortens. (Fig. 1). This observation could indicate that metabolism at lower
2
H b: increased Q distributes preferentially to edematous lung values of D O 2 was anaerobic. However, plotting calculated vari-
L
O
regions. ables having shared parameters (viz CO, Ca O 2 ) with measurement
To test H a, we used the multiple inert gas elimination technique error produces just such a correlation in the absence of anaerobic
O
(MIGET) in both lower lobes and the whole lung before and after metabolism. This was confirmed in the same studies by measuring
8,9
increasing Q suddenly and reversibly from 3.0 to 5.5 lpm by open- V O 2 G [VE × (Fi O 2 − Fe O 2 )], a variable which showed no correlation
L
ing two systemic a-v fistulas. Unilobar acute lung injury (ALI) was with D O 2 . Unfortunately, earlier studies concluded erroneously that
produced by oleic acid injected into the left lower lobar pulmonary metabolism was anaerobic which led to maximizing D O 2 when the
artery. MIGET demonstrated no diffusion defect for O at either Q , patient didn’t need more O , so volume loading and high levels of
L
2
2
5
so we rejected H a. And the lobar distribution of Q measured by dobutamine aggravated pulmonary edema and arrhythmias.
L
O
differentially labeled radioactive microspheres did not change when 3. Sometimes it is difficult to distinguish science from belief in reveal-
5
Q increased, so we rejected H b, and formulated another hypothesis.
L O ing truth. In 2006, a multicenter clinical study of fluid management
H c: increased Q increases edema to increase Q /Q . The key strategies in 1000 patients with ALI demonstrated that conservative
T
S
L
O
additional measurement needed to test H c was an in vivo repro- fluids were associated with fewer ventilator days without adverse
O
ducible accurate double indicator dilution estimate of extra vascular cardio vascular effects compared to patients with liberal fluid
thermal volume (ETV) which uses heat as the diffusible indicator. management. Twenty-five years earlier, we had demonstrated in
10
When Q was increased from 5.0 to 6.9 lpm by opening a-v fistulas, canine models of AHRF that reduction of PAOP by 5 mm Hg 1 hour
L
Q /Q rose from 30% to 38%, but ETV did not change (7.8-7.4 mL/g after ALI reduced edema accumulation by 50% during the next 4
S
T
dry lung). So we rejected H c and formulated a fourth H . 11,12
6
O O hours. In the intervening quarter century, considerable debate
L
O
H d: increased Q raises mixed venous P O 2 (Pv O 2 ), which blocks was waged between proponents of these strategies. I thought our
hypoxic pulmonary vasoconstriction (HPV) to send a greater pro- results and the management goal arising—seek the lowest PAOP
portion of increased Q to intralobar edematous regions to increase —were good science, and I used
L
Q /Q . To test H d, we used an isolated blood perfused edematous providing adequate CO and D O 2
that goal in all my patients with AHRF (Table 2), while others were
T
S
O
canine lower lobe. When lobar blood flow increased with no change worried about causing inadequate cardiac output, so they ensured
was increased using
T
S
in Pv O 2 , Q /Q did not change. But when Pv O 2 enough positive fluid balance to maintain or even maximize CO and
an oxygenator with no change in flow, Q /Q increased. At last, . Accordingly, I was delighted that the clinical study confirmed
T
S
we found an hypothesis we could not falsify, so we concluded that D O 2
our approach, but asked myself, “was this science or belief?” It was
blocks
S
T
L
Q /Q is increased by increased Q when the greater Pv O 2 indeed scientifically sound treatment for canine models of AHRF,
HPV to increase blood flow to edematous intralobar lung regions. 7 but it was my belief that these canine results would occur in patients
Pheewf!! That was a lot of work, and the scientific method was that drove me to treat them with this regime while awaiting the clini-
slow and tedious despite creative experimentation with optimal cal trial results. Perhaps we were lucky, perhaps intuition counts, or
measuring devices, in part because there are so many erroneous perhaps studying an appropriate animal model can provide direction
hypotheses that need to be falsified before the truth becomes evident. long before the clinical trial can be organized and implemented. The
2. A second limit on science is that the underlying mechanism may lesson from these studies is that solid science in animal models led to
be misinterpreted, so care must be taken to question each step of treatment goals for the models, but extension of those goals to treat
intro.indd 26 19-01-2015 16:50:51