
Page 229 - Cardiac Nursing
P. 229
Pa
g
M
Pa
g
e 2
05
g
e 2
1
1
/09
/09
1:1
7 P
M
1:1
7 P
05
a
a
ara
a
a
c.
c.
In
In
p
p
A
A
p
ara
ara
t
t
4-2
4-2
10.
10.
20
09_
0-c
20
09_
q
/29
6
6
/29
6
q
q
xd
xd
0-c
LWBK340-c09_ p p pp204-210.qxd 6/29/09 11:17 PM Page 205 Aptara Inc.
K34
K34
C HAPTER 9 / Physiologic Adaptations With Aging 205
Number of people age 65 and over, by age group, selected years 1900-2006
and projected 2010-2050
100
90
80
70
60
Millions 50
40 65 and over
30
20
10 85 and over
0
1900 1910 1920 1930 1940 1950 1960 1970 1980 1990 2000 2010 2020 2030 2040 2050
2006
Projected
Note: Data for 2010-2050 are projections of the population.
Reference population: These data refer to the resident population.
Source: U.S. Census Bureau, Decennial Census, Population Estimates and Projections.
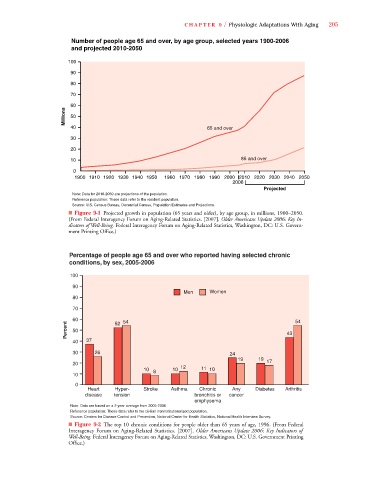
■ Figure 9-1 Projected growth in population (65 years and older), by age group, in millions, 1900–2050.
(From Federal Interagency Forum on Aging-Related Statistics. [2007]. Older Americans Update 2006: Key In-
dicators of Well-Being. Federal Interagency Forum on Aging-Related Statistics, Washington, DC: U.S. Govern-
ment Printing Office.)
Percentage of people age 65 and over who reported having selected chronic
conditions, by sex, 2005-2006
100
90
Men Women
80
70
60 52 54 54
Percent 50 43
40 37
30 26 24
19 19 17
20
10 8 10 12 11 10
10
0
Heart Hyper- Stroke Asthma Chronic Any Diabetes Arthritis
disease tension bronchitis or cancer
emphysema
Note: Data are based on a 2-year average from 2005-2006.
Reference population: These data refer to the civilian noninstitutionalized population.
Source: Centers for Disease Control and Prevention, National Center for Health Statistics, National Health Interview Survey.
■ Figure 9-2 The top 10 chronic conditions for people older than 65 years of age, 1996. (From Federal
Interagency Forum on Aging-Related Statistics. [2007]. Older Americans Update 2006: Key Indicators of
Well-Being. Federal Interagency Forum on Aging-Related Statistics, Washington, DC: U.S. Government Printing
Office.)