
Page 288 - Cardiac Nursing
P. 288
LWBK340-c11_p245-266.qxd 6/29/09 10:21 PM Page 264 Aptara Inc.
264 PA R T III / Assessment of Heart Disease
6. Grant, M. S. (2003). The effect of blood drawing techniques and equip-
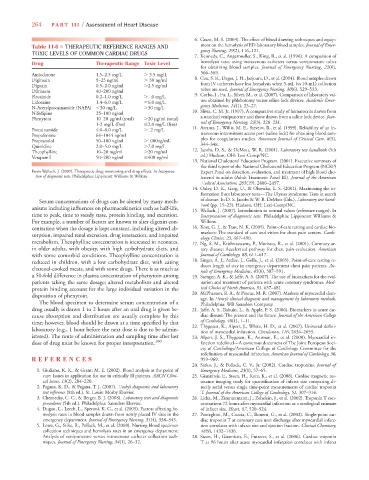
Table 11-6 ■ THERAPEUTIC REFERENCE RANGES AND ment on the hemolysis of ED laboratory blood samples. Journal of Emer-
gency Nursing, 29(2), 116–121.
TOXIC LEVELS OF COMMON CARDIAC DRUGS
7. Kennedy, C., Angermuller, S., King, R., et al. (1996). A comparison of
Drug Therapeutic Range Toxic Level hemolysis rates using intravenous catheters versus venipuncture tubes
for obtaining blood samples. Journal of Emergency Nursing, 22(6),
Amiodarone 1.5–2.5 mg/L 3.5 mg/L 566–569.
Digitoxin 9–25 ng/ml 30 ng/ml 8. Cox, S. R., Dages, J. H., Jarjoura, D., et al. (2004). Blood samples drawn
Digoxin 0.5–2.0 ng/ml 2.5 ng/ml from IV catheters have less hemolysis when 5-mL (vs 10-mL) collection
Diltiazem 40–200 ng/ml tubes are used. Journal of Emergency Nursing, 30(6), 529–533.
Flecainide 0.2–1.0 mg/L 1.0 mg/L 9. Corbo, J., Fu, L., Silver, M., et al. (2007). Comparison of laboratory val-
Lidocaine 1.4–6.0 mg/L 6.0 mg/L ues obtained by phlebotomy versus saline lock devices. Academic Emer-
N-Acetylprocainamide (NAPA) 30 mg/L 30 mg/L gency Medicine, 14(1), 23–27.
Nifedipine 25–100 ng/ml 10. Sliwa, C. M. Jr. (1997). A comparative study of hematocrits drawn from
Phenytoin 10–20 μg/ml (total) 20 μg/ml (total) a standard venipuncture and those drawn from a saline lock device. Jour-
1-2 mg/L (free) 2.0 mg/L (free) nal of Emergency Nursing, 23(3), 228–231.
Procainamide 4.0–8.0 mg/L 12 mg/L 11. Arrants, J., Willis, M. E., Stevens, B., et al. (1999). Reliability of an in-
Propafenone 64–1044 ng/ml travenous intermittent access port (saline lock) for obtaining blood sam-
Propranolol 50–100 ng/ml 1000ng/mL ples for coagulation studies. American Journal of Critical Care, 8(5),
Quinidine 2.0–5.0 mg/L 7.0 mg/L 344–348.
Theophylline 10–20 mg/ml 20 mg/ml 12. Jacobs, D. S., & DeMott, W. R. (2001). Laboratory test handbook (5th
Verapamil 50–200 ng/ml 400 ng/ml ed.) Hudson, OH: Lexi-Comp/NC.
13. National Cholesterol Education Program. (2001). Executive summary of
the third report of the National Cholesterol Education Program (NCEP)
From Wallach, J. (2007). Therapeutic drug monitoring and drug effects. In Interpreta- Expert Panel on detection, evaluation, and treatment of high blood cho-
tion of diagnostic tests. Philadelphia: Lippincott Williams & Wilkins lesterol in adults (Adult Treatment Panel III). Journal of the American
Medical Association, 285(19), 2486–2497.
14. Oxley, D. K., Garg, U., & Olsowka, E. S. (2001). Maximizing the in-
formation from laboratory tests—The Ulysses syndrome: Tests in search
Serum concentrations of drugs can be altered by many mech- of disease. In D. S. Jacobs & W. R. DeMott (Eds.), Laboratory test hand-
book (pp. 15–23). Hudson, OH: Lexi-Comp/NC.
anisms including influences on pharmacokinetics such as half-life,
15. Wallach, J. (2007). Introduction to normal values (reference ranges). In
time to peak, time to steady state, protein binding, and excretion. Interpretation of diagnostic tests. Philadelphia: Lippincott Williams &
For example, a number of factors are known to alter digoxin con- Wilkins.
centration when the dosage is kept constant, including altered ab- 16. Kost, G. J., & Tran, N. K. (2005). Point-of-care testing and cardiac bio-
markers: The standard of care and vision for chest pain centers. Cardi-
sorption, impaired renal excretion, drug interaction, and impaired
ology Clinics, 23, 467–490.
metabolism. Theophylline concentration is increased in neonates, 17. Ng, S. M., Krishnaswamy, P., Morissey, R., et al. (2001). Coronary ar-
in older adults, with obesity, with high carbohydrate diets, and tery disease: Accelerated pathway for chest pain evaluation. American
with some comorbid conditions. Theophylline concentration is Journal of Cardiology, 88, 611–617.
reduced in children, with a low carbohydrate diet, with eating 18. Singer, A. J., Ardise, J., Gulla, J., et al. (2005). Point-of-care testing re-
duces length of stay in emergency department chest pain patients. An-
charcoal-cooked meats, and with some drugs. There is as much as
nals of Emergency Medicine, 45(6), 587–591.
a 50-fold difference in plasma concentration of phenytoin among 19. Saenger, A. K., & Jaffe, A. S. (2007). The use of biomarkers for the eval-
patients taking the same dosage; altered metabolism and altered uation and treatment of patients with acute coronary syndromes. Med-
protein binding account for the large individual variation in the ical Clinics of North America, 91, 657–681.
20. McPherson, R. A., & Pincus, M. R. (2007). Markers of myocardial dam-
disposition of phenytoin.
age. In Henry’s clinical diagnosis and management by laboratory methods.
The blood specimen to determine serum concentration of a Philadelphia: WB Saunders Company.
drug usually is drawn 1 to 2 hours after an oral drug is given be- 21. Jaffe, A. S., Babuin, L., & Apple, F. S. (2006). Biomarkers in acute car-
cause absorption and distribution are usually complete by this diac disease: The present and the future. Journal of the American College
time; however, blood should be drawn at a time specified by that of Cardiology, 48(1), 1–11.
22. Thygesen, K., Alpert, J., White, H. D., et al. (2007). Universal defini-
laboratory (e.g., 1 hour before the next dose is due to be admin-
6
tion of myocardial infarction. Circulation, 116, 2634–2653.
6
istered). The route of administration and sampling time after last 23. Alpert, J. S., Thygesen, K., Antman, E., et al. (2000). Myocardial in-
dose of drug must be known for proper interpretation. 100 farction redefined—A consensus document of The Joint European Soci-
ety of Cardiology/American College of Cardiology Committee for the
redefinition of myocardial infarction. American Journal of Cardiology, 36,
6
6
REFEREN C E S 959–969.
24. Sarko, J., & Pollack, C. V., Jr. (2002). Cardiac troponins. Journal of
1. Giuliano, K. K., & Grant, M. E. (2002). Blood analysis at the point of Emergency Medicine, 23(1), 57–65.
care: Issues in application for use in critically ill patients. AACN Clini- 25. Giannitsis, E., Steen, H., Kurz, K., et al. (2008). Cardiac magnetic res-
cal Issues, 13(2), 204–220. onance imaging study for quantification of infarct size comparing di-
2. Pagana, K. D., & Pagana, T. J. (2007). Mosby’s diagnostic and laboratory rectly serial versus single time-point measurements of cardiac troponin
test reference (8th ed.). St. Louis: Mosby Elsevier. T. Journal of the American College of Cardiology, 51, 307–314.
3.Chernecky, C. C., & Berger, B. J. (2008). Laboratory tests and diagnostic 26. Licka, M., Zimmermann, J., Zehelein, J., et al. (2002). Troponin T con-
procedures (5th ed.). Philadelphia: Saunders Elsevier. centrations 72 hours after myocardial infarction as a serological estimate
4. Dugan, L., Leech, L., Speroni, K. G., et al. (2005). Factors affecting he- of infarct size. Heart, 87, 520–524.
7
7
molysis rates in blood samples drawn from newly placed IV sites in the 27. Panteghini, M., Cuccia, C., Bonetti, G., et al. (2002). Single-point car-
emergency department. Journal of Emergency Nursing, 31(4), 338–345. diac troponin T at coronary care unit discharge after myocardial infarc-
5. Lowe, G., Stike, R., Pollack, M., et al. (2008). Nursing blood specimen tion correlates with infarct size and ejection fraction. Clinical Chemistry,
collection techniques and hemolysis rates in an emergency department: 48(9), 1432–1436.
Analysis of venipuncture versus intravenous catheter collection tech- 28. Steen, H., Giannitsis, E., Futterer, S., et al. (2006). Cardiac troponin
niques. Journal of Emergency Nursing, 34(1), 26–32. T at 96 hours after acute myocardial infarction correlates with infarct