
Page 36 - Williams Hematology ( PDFDrive )
P. 36
12 Part I: Clinical Evaluation of the Patient Chapter 2: Examination of Blood Cells 13
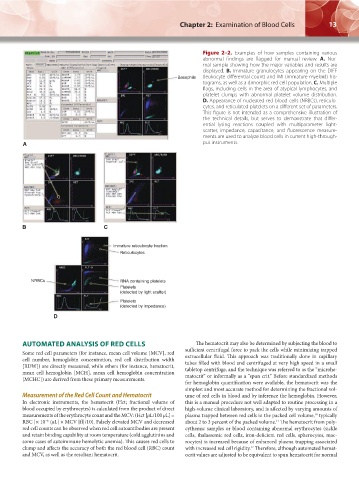
Figure 2–2. Examples of how samples containing various
abnormal findings are flagged for manual review. A. Nor-
mal sample showing how the major variables and results are
displayed. B. Immature granulocytes appearing on the DIFF
Basophils (leukocyte differential count) and IMI (immature myeloid) his-
tograms, as well as a dimorphic red cell population. C. Multiple
flags, including cells in the area of atypical lymphocytes, and
platelet clumps with abnormal platelet volume distribution.
D. Appearance of nucleated red blood cells (NRBCs), reticulo-
cytes, and reticulated platelets on a different set of parameters.
This figure is not intended as a comprehensive illustration of
the technical details, but serves to demonstrate that differ-
ential lysing reactions coupled with multiparameter light-
scatter, impedance, capacitance, and fluorescence measure-
ments are used to analyze blood cells in current high-through-
A put instruments.
B C
Immature reticulocyte fraction
Reticulocytes
NRBCs RNA containing platelets
Platelets
(detected by light scatter)
Platelets
(detected by impedance)
D
AUTOMATED ANALYSIS OF RED CELLS The hematocrit may also be determined by subjecting the blood to
sufficient centrifugal force to pack the cells while minimizing trapped
Some red cell parameters (for instance, mean cell volume [MCV], red extracellular fluid. This approach was traditionally done in capillary
cell number, hemoglobin concentration, red cell distribution width tubes filled with blood and centrifuged at very high speed in a small
[RDW]) are directly measured, while others (for instance, hematocrit, tabletop centrifuge, and the technique was referred to as the “microhe-
mean cell hemoglobin [MCH], mean cell hemoglobin concentration matocrit” or informally as a “spun crit.” Before standardized methods
[MCHC]) are derived from these primary measurements.
for hemoglobin quantification were available, the hematocrit was the
simplest and most accurate method for determining the fractional vol-
Measurement of the Red Cell Count and Hematocrit ume of red cells in blood and by inference the hemoglobin. However,
In electronic instruments, the hematocrit (Hct; fractional volume of this is a manual procedure not well adapted to routine processing in a
blood occupied by erythrocytes) is calculated from the product of direct high-volume clinical laboratory, and is affected by varying amounts of
measurements of the erythrocyte count and the MCV: (Hct [μL/100 μL] = plasma trapped between red cells in the packed cell volume, typically
16
RBC [× 10 /μL] × MCV [fl]/10). Falsely elevated MCV and decreased about 2 to 3 percent of the packed volume. The hematocrit from poly-
−6
17
red cell counts can be observed when red cell autoantibodies are present cythemic samples or blood containing abnormal erythrocytes (sickle
and retain binding capability at room temperature (cold agglutinins and cells, thalassemic red cells, iron-deficient red cells, spherocytes, mac-
some cases of autoimmune hemolytic anemia). This causes red cells to rocytes) is increased because of enhanced plasma trapping associated
clump and affects the accuracy of both the red blood cell (RBC) count with increased red cell rigidity. Therefore, although automated hemat-
17
and MCV, as well as the resultant hematocrit. ocrit values are adjusted to be equivalent to spun hematocrit for normal
Kaushansky_chapter 02_p0011-0026.indd 13 17/09/15 5:34 pm