
Page 38 - Williams Hematology ( PDFDrive )
P. 38
14
Part I: Clinical Evaluation of the Patient
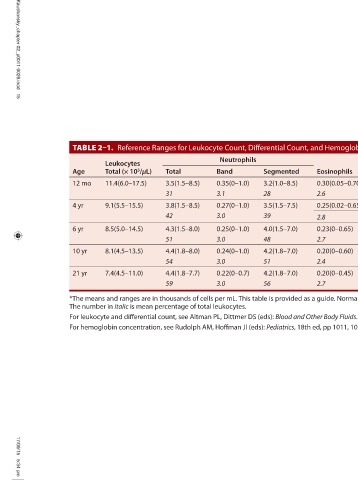
*The means and ranges are in thousands of cells per mL. This table is provided as a guide. Normal ranges should be validated by the clinical laboratory for the specific methods in use.
For leukocyte and differential count, see Altman PL, Dittmer DS (eds): Blood and Other Body Fluids. Federation of American Societies for Experimental Biology, Washington, DC, 1961.
M: 15.5(13.5–17.5)
F: 13.8(12.0–15.6)
13.4(11.8–15.0)
0.35(0–0.8)
0.30(0–0.8)
4.7
4.0
4.3
2.5(1.0–4.8)
3.1(1.5–6.5)
Reference Ranges for Leukocyte Count, Differential Count, and Hemoglobin Concentration in Children*
38
34
42
0.04(0–0.2)
0.04(0–0.2)
0.5
0.5
0.6
0.20(0–0.60)
0.20(0–0.45)
Eosinophils Hemoglobin g/dL Blood Monocytes Lymphocytes Basophils 12.6(11.1–14.1) 0.55(0.05–1.1) 7.0(4.0–10.5) 0.05(0–0.20) 0.30(0.05–0.70) 4.8 61 0.4 2.6 12.7(11.2–14.3) 0.45(0–0.8) 4.5(2.0–8.0) 0.05(0–0.2) 0.25(0.02–0.65) 5.0 50 0.6 2.8 13.0(11.4–14.5) 0.40(0–0.8) 3.5(1.5–7.0) 0.05(0–0.2) 0.23(0–0.65) Chapter 2: Examination of Blood Cells 15
2.4
2.7
2.7
Segmented 3.2(1.0–8.5) 28 3.5(1.5–7.5) 39 4.0(1.5–7.0) 48 4.2(1.8–7.0) 51 4.2(1.8–7.0) 56 For hemoglobin concentration, see Rudolph AM, Hoffman JI (eds): Pediatrics, 18th ed, pp 1011, 1012. Appleton and Lange, Norwalk, CT, 1987.
Neutrophils Band 0.35(0–1.0) 3.1 0.27(0–1.0) 3.0 0.25(0–1.0) 3.0 0.24(0–1.0) 3.0 0.22(0–0.7) 3.0
3.5(1.5–8.5) 3.8(1.5–8.5) 4.3(1.5–8.0) 4.4(1.8–8.0) 4.4(1.8–7.7)
Total 31 42 51 54 59 The number in italic is mean percentage of total leukocytes.
Leukocytes Total (× 10 3 /μL) 11.4(6.0–17.5) 9.1(5.5–15.5) 8.5(5.0–14.5) 8.1(4.5–13.5) 7.4(4.5–11.0)
TABLE 2–1. Age 12 mo 4 yr 6 yr 10 yr 21 yr
Kaushansky_chapter 02_p0011-0026.indd 15 17/09/15 5:34 pm