
Page 653 - 9780077418427.pdf
P. 653
Volume/207/MHDQ243/tiL12214_disk1of1/0073512214/tiL12214_pagefiles
tiL12214_appa_623-630.indd Page 630 09/10/10 8:36 AM user-f463
tiL12214_appa_623-630.indd Page 630 09/10/10 8:36 AM user-f463 Volume/207/MHDQ243/tiL12214_disk1of1/0073512214/tiL12214_pagefile
3
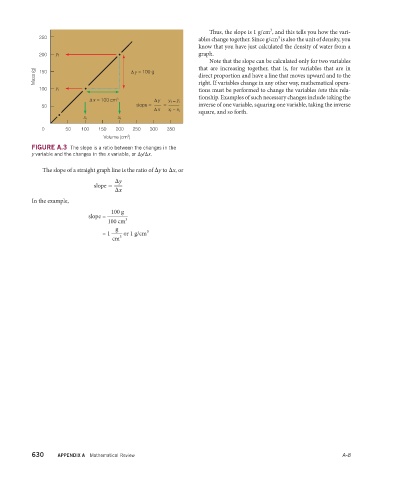
Thus, the slope is 1 g/cm , and this tells you how the vari-
250 3
ables change together. Since g/cm is also the unit of density, you
know that you have just calculated the density of water from a
200 y f graph.
that are increasing together, that is, for variables that are in
Note that the slope can be calculated only for two variables
Mass (g) 150 Δ y = 100 g direct proportion and have a line that moves upward and to the
100 y i right. If variables change in any other way, mathematical opera-
tions must be performed to change the variables into this rela-
tionship. Examples of such necessary changes include taking the
Δ x = 100 cm 3 Δ y y f – y i
50 slope = = inverse of one variable, squaring one variable, taking the inverse
Δ x x f – x i
square, and so forth.
x i x f
0 50 100 150 200 250 300 350
3
Volume (cm )
FIGURE A.3 The slope is a ratio between the changes in the
y variable and the changes in the x variable, or Δy/Δx.
The slope of a straight graph line is the ratio of Δy to Δx, or
Δy
_
slope =
Δx
In the example,
100 g
_
slope =
100 cm 3
g
_ 3
= 1 or 1 g/cm
3
cm
630 APPENDIX A Mathematical Review A-8