
Page 82 - Steady Mate Tg1 - Book B
P. 82
Matematik Tingkatan 1 Bab 12 Pengendalian Data
MESTI TAHU & INGAT
Graf garis digunakan untuk menunjukkan sesuatu kuantiti berubah dalam satu tempoh masa.
A line graph is used to show a quantity changes over time.
E Bina graf garis untuk mewakili data yang berikut. TP 3 ARAS R
Construct a line graph to represent the following data.
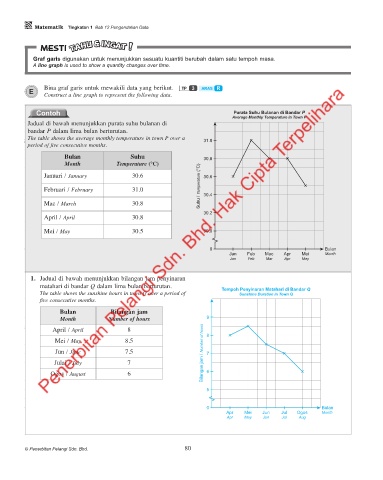
Contoh Average Monthly Temperature in Town P
Purata Suhu Bulanan di Bandar P
Jadual di bawah menunjukkan purata suhu bulanan di
bandar P dalam lima bulan berturutan.
The table shows the average monthly temperature in town P over a
31.0
period of five consecutive months.
Bulan Suhu 30.8
Month Temperature (°C)
Suhu / Temperature (°C)
Januari / January 30.6 30.6
Februari / February 31.0 30.4
Mac / March 30.8
30.2
April / April 30.8
Mei / May 30.5 30.0
0 Bulan
Jan Feb Mac Apr Mei Month
Jan Feb Mar Apr May
1. Jadual di bawah menunjukkan bilangan jam penyinaran
matahari di bandar Q dalam lima bulan berturutan. Tempoh Penyinaran Matahari di Bandar Q
The table shows the sunshine hours in town Q over a period of Sunshine Duration in Town Q
five consecutive months.
Bulan Bilangan jam
Month Number of hours 9
Bilangan jam / Number of hours 7
April / April 8 8
Mei / May 8.5
Jun / June 7.5
Julai / July 7
Ogos / August 6 6
5
0 Bulan
Apr Mei Jun Jul Ogos Month
Apr May Jun Jul Aug
© Penerbitan Pelangi Sdn. Bhd. 80