Page 48 - Focus TG4 KSSM (Physics) Terbitan Penerbitan Pelangi Sdn Bhd
P. 48

Physics  Form 4  Chapter 2 Force and Motion I
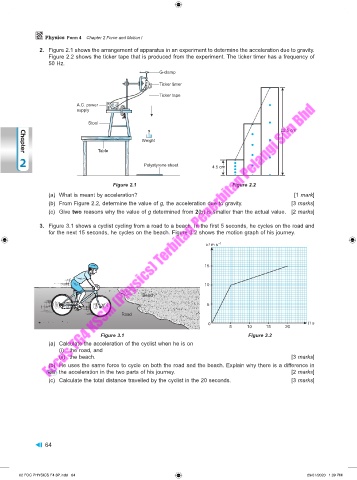
               2.  Figure 2.1 shows the arrangement of apparatus in an experiment to determine the acceleration due to gravity.
                 Figure 2.2 shows the ticker tape that is produced from the experiment. The ticker timer has a frequency of
                 50 Hz.
                                                     G-clamp
                                                     Ticker timer

                                                     Ticker tape
                          A.C. power
                          supply
                              Stool
                                                                                            22.5 cm
                                               Weight
                                 Table
        Chapter
       2                                        Polystyrene sheet     4.5 cm


                                      Figure 2.1                             Figure 2.2
                 (a)  What is meant by acceleration?                                             [1 mark]
                 (b)  From Figure 2.2, determine the value of g, the acceleration due to gravity.   [3 marks]
                 (c)  Give two reasons why the value of g determined from 2(b) is smaller than the actual value.  [2 marks]

               3.  Figure 3.1 shows a cyclist cycling from a road to a beach. In the first 5 seconds, he cycles on the road and
                 for the next 15 seconds, he cycles on the beach. Figure 3.2 shows the motion graph of his journey.

                                                                    v / m s –1


                                                                    15

                                                                    10
                                               Beach

                                                                    5
                                         Road
                                                                     0                               t / s
                                                                            5    10     15    20
                                  Figure 3.1                                      Figure 3.2
                 (a)  Calculate the acceleration of the cyclist when he is on
                    (i)  the road, and
                    (ii)  the beach.                                                            [3 marks]
                 (b)  He uses the same force to cycle on both the road and the beach. Explain why there is a difference in
                 HOTS  the acceleration in the two parts of his journey.                        [2 marks]
                 (c)  Calculate the total distance travelled by the cyclist in the 20 seconds.   [3 marks]


                64


       02 FOC PHYSICS F4 3P.indd   64                                                                29/01/2020   1:39 PM
   43   44   45   46   47   48   49   50   51   52   53