
Page 52 - Focus TG4 KSSM (Physics) Terbitan Penerbitan Pelangi Sdn Bhd
P. 52
Physics Form 4 Answers
• Strength: The graph Q3 50 ticks per second. (b) Velocity = Gradient of graph
drawn is big. Therefore, 1 tick = 0.02 s = 2.0 – 0.5
(ii) Graph of student B The time taken for each strip of 3.8 – 2.4
• Strength : Horizontal axis, ticker tape = 1.1 m s –1
5 divisions for 0.2 A is an = 5 ticks × 0.02 s (c) Average velocity
easier scale to determine = 0.1 s
the exact position of value (a) Initial velocity, = Displacement
l. 3.0 Time taken
• Strength : Vertical axis, 5 u = 0.1 = 2.0
divisions for 0.5 V is an = 30.0 cm s –1 5.0
easier scale to determine = 0.4 m s –1
the exact position of value (b) Final velocity, v = 10.2 Q2 (a) s = Area under the graph from
0.1
V. 0 s to 14 s = 100 m
• Weakness : The graph = 102.0 cm s –1 (b) The bus stopped from t = 14 s
drawn is small. (c) Time taken between u and v, to 20 s. Therefore, it stopped for
(iii) Graph of student C t = 1 + 1 + 1 + 1 × 0.1 6 s.
• Weakness: Horizontal 2 2
axis, 5 divisions for 0.1 = 0.3 s (c) Gradient of graph
A is not suitable because Acceleration, a = v – u = 0 – 20
it does not cover the t 60 – 50
whole range of values 102.0 – 30.0 = –20
10
of l determined from the = 0.3 = –2.0 m s –2
experiment. = 240 cm s –2
• Weakness: Vertical axis, or 2.4 m s –2 (d) Distance between the two bus
5 divisions for 0.4 V is a stops = Distance travelled from
–1
–1
difficult scale to determine Q4 (a) u = 8 m s ; v = 4 m s ; s = 6 m 20 s to 60 s
the exact position of value s = u + v × t = Area under the graph from
V. 2 20 s to 60 s
• Weakness: The graph is t = 2s = 580 m
not complete because u + v Q3 (a) (i) Total distance travelled
some of the data from = 2 × 6 = 35 × 2
the experiment cannot be 4 + 8 = 70 m
plotted. = 1 s (ii) Average speed
(b) a = v – u 70
t = 55
Chapter = 4 – 8 = 1.27 m s (or 1.3 m s )
–1
–1
1
2 Force and Motion I = –4 m s –2 (b) t = 10 s to 20 s
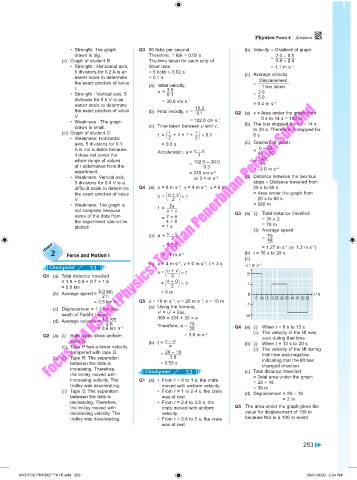
(c)
(c) u = 4 m s ; v = 0 m s ; t = 3 s –1
–1
–1
Checkpoint 2.1 v / m s
s = u + v × t
Q1 (a) Total distance travelled 2 2
= 1.8 + 0.9 + 0.7 + 1.6 = 4 + 0 × 3 1
= 5.0 km 2
(b) Average speed = 5.0 km = 6 m 0 t / s
2 h 510152025303540455055
–1
–1
= 2.5 km h –1 Q5 u = 18 m s ; v = 20 m s ; s = 10 m
(a) Using the formula, -1
(c) Displacement = 1.2 km due 2 2
south of Farid’s house. v = u + 2as, -2
(d) Average velocity = 1.2 km 400 = 324 + 20 × a
76
2 h
= 0.6 km h –1 Therefore, a = 20 Q4 (a) (i) When t = 8 s to 13 s
Q2 (a) (i) Both tapes show uniform = 3.8 m s –2 (ii) The velocity of the lift was
zero during that time.
velocity. (b) t = v – u (b) (i) When t = 13 s to 20 s
(ii) Tape P has a lower velocity a (ii) The velocity of the lift during
compared with tape Q. = 20 – 18 that time was negative,
(b) (i) Tape R: The separation 3.8 indicating that the lift has
between the dots is = 0.53 s changed direction.
increasing. Therefore, Checkpoint (c) Total distance travelled
the trolley moved with 2.2 = Total area under the graph
increasing velocity. The Q1 (a) • From t = 0 to 1 s, the crate = 20 + 18
trolley was accelerating. moved with uniform velocity. = 38 m
(ii) Tape S: The separation • From t = 1 to 2.4 s, the crate (d) Displacement = 20 – 18
between the dots is was at rest. = 2 m
decreasing. Therefore, • From t = 2.4 to 3.8 s, the
the trolley moved with crate moved with uniform Q5 The area under the graph gives the
decreasing velocity. The velocity. value for displacement of 100 m
trolley was decelerating. • From t = 3.8 to 5 s, the crate because this is a 100 m event
was at rest.
253
ANS FOC PHYSICF F4 1P.indd 253 29/01/2020 2:04 PM