
Page 32 - Q & A STPM 2022 Biology
P. 32
Biology STPM Chapter 7 Gaseous Exchange
Question 2
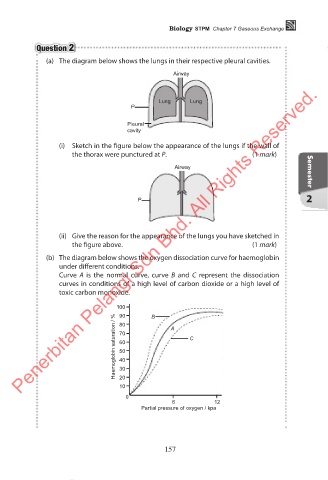
(a) The diagram below shows the lungs in their respective pleural cavities.
Airway
Penerbitan Pelangi Sdn Bhd. All Rights Reserved.
Lung Lung
P
Pleural
cavity
(i) Sketch in the figure below the appearance of the lungs if the wall of
the thorax were punctured at P. (1 mark)
Airway Semester
P 2
(ii) Give the reason for the appearance of the lungs you have sketched in
the figure above. (1 mark)
(b) The diagram below shows the oxygen dissociation curve for haemoglobin
under different conditions.
Curve A is the normal curve, curve B and C represent the dissociation
curves in conditions of a high level of carbon dioxide or a high level of
toxic carbon monoxide.
100 B
90
Haemoglobin saturation / % 70 A C
80
60
50
40
30
20
10
0
6 12
Partial pressure of oxygen / kpa
157
Chapter 7.indd 157 11/2/21 9:27 AM