
Page 187 - The Effect of Hydrogen and Hydrides - ebook first test
P. 187
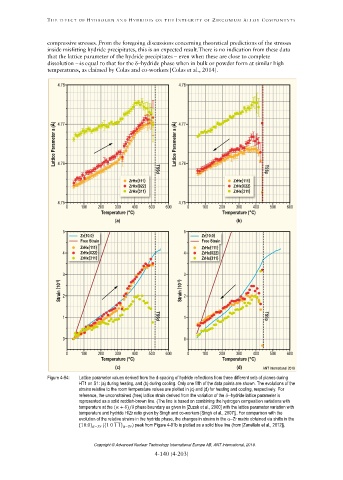
Figure 4-94: Lattice parameter values derived from the d-spacing of hydride reflections from three different sets of planes during
HT1 on S1: (a) during heating, and (b) during cooling. Only one fifth of the data points are shown. The evolutions of the
strains relative to the room temperature values are plotted in (c) and (d) for heating and cooling, respectively. For
reference, the unconstrained (free) lattice strain derived from the variation of the hydride lattice parameter is
represented as a solid reddish-brown line. (The line is based on combining the hydrogen composition variations with
temperature at the (α + )/ phase boundary as given in [Zuzek et al., 2000] with the lattice parameter variation with
temperature and hydride H/Zr ratio given by Singh and co-workers [Singh et al., 2007]). For comparison with the
evolution of the relative strains in the hydride phase, the changes in strains in the αZr matrix obtained via shifts in the
̅̅̅̅
{10.0} − ({1 0 1 1} − ) peak from Figure 4-91b is plotted as a solid blue line (from [Zanellato et al., 2012]).
Copyright © Advanced Nuclear Technology International Europe AB, ANT International, 2019.