
Page 209 - The Effect of Hydrogen and Hydrides - ebook first test
P. 209
(Perovic)
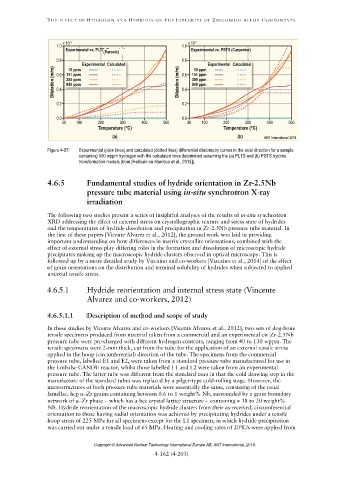
Figure 4-97: Experimental (plain lines) and calculated (dotted lines) differential dilatometry curves in the axial direction for a sample
containing 500 wppm hydrogen with the calculated lines determined assuming the (a) PLTS and (b) PSTS hydride
transformation models (from [Hellouin de Menibus et al., 2013]).
4.6.5.1
α
α
Copyright © Advanced Nuclear Technology International Europe AB, ANT International, 2019.