Page 212 - The Effect of Hydrogen and Hydrides - ebook first test
P. 212

α 
                                                                                     α
                  

                          {1 1 1}     {2 2 0}                                                    α
                                                       {0 0 0 2}   −       = 0°
                     = 70°.
                  {0 0 0 2}   −      {1 1 1}   


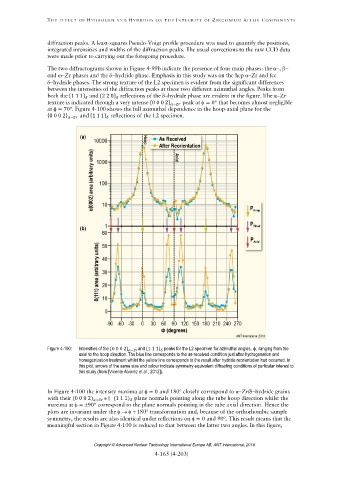
                  Figure 4-100:   Intensities of the {0 0 0 2}   −     and {1 1 1}  peaks for the L2 specimen for azimuthal angles, ϕ, ranging from the
                                                             
                             axial to the hoop direction. The blue line corresponds to the as-received condition just after hydrogenation and
                             homogenization treatment whilst the yellow line corresponds to the result after hydride reorientation had occurred. In
                             this plot, arrows of the same size and colour indicate symmetry equivalent diffracting conditions of particular interest to
                             this study (from [Vicente Alvarez et al., 2012]).


                                                      = 0                           α   
                           (0 0 0 2)   −      ∥ (1 1 1)   
                             = 90°
                                             +   
                                                                       = 0      


                                   Copyright © Advanced Nuclear Technology International Europe AB, ANT International, 2019.
   207   208   209   210   211   212   213   214   215   216   217