
Page 222 - The Effect of Hydrogen and Hydrides - ebook first test
P. 222
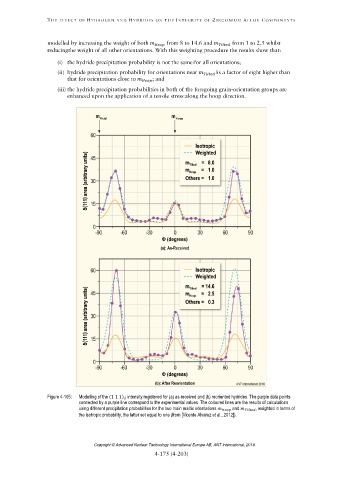
                  Figure 4-105:   Modelling of the (1 1 1)  intensity registered for (a) as-received and (b) reoriented hydrides. The purple data points

                             connected by a purple line correspond to the experimental values. The coloured lines are the results of calculations
                             using different precipitation probabilities for the two main matrix orientations              and                 , weighted in terms of
                             the isotropic probability, the latter set equal to one (from [Vicente Alvarez et al., 2012]).


                                   Copyright © Advanced Nuclear Technology International Europe AB, ANT International, 2019.