
Page 275 - The Effect of Hydrogen and Hydrides - ebook first test
P. 275
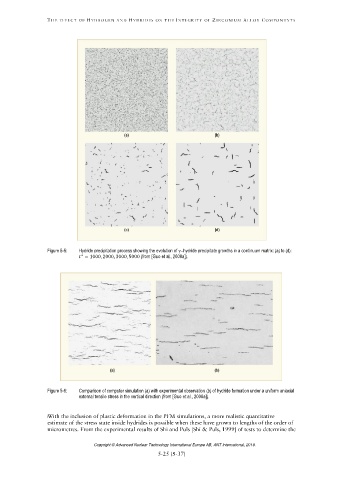
Figure 5-5: Hydride precipitation process showing the evolution of hydride precipitate growths in a continuum matrix: (a) to (d):
∗
= 1000, 2000, 3000, 5000 (from [Guo et al., 2008a]).
Figure 5-6: Comparison of computer simulation (a) with experimental observation (b) of hydride formation under a uniform uniaxial
external tensile stress in the vertical direction (from [Guo et al., 2008a]).
Copyright © Advanced Nuclear Technology International Europe AB, ANT International, 2019.