
Page 92 - The Effect of Hydrogen and Hydrides - ebook first test
P. 92
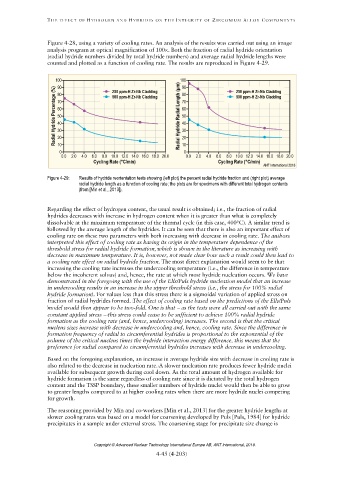
Figure 4-29: Results of hydride reorientation tests showing (left plot) the percent radial hydride fraction and (right plot) average
radial hydride length as a function of cooling rate; the plots are for specimens with different total hydrogen contents
(from [Min et al., 2013]).
Copyright © Advanced Nuclear Technology International Europe AB, ANT International, 2019.