Page 1033 - How to Make Money in Stocks Trilogy
P. 1033

®
                                                                       © 2013 Investor’s Business Daily, Inc.
                                                          120,000,000
                                                             70,000,000
                                                                  20,000,000
                                                               40,000,000
                                  190
                                    170
                              240
                               220
                                      150
                                          120
                                            110
                                        140
                                         130
                   420
                     380
                500
                  460
                       340
                           280
                            260
                          300
                                                       Volume
            Price
                                                       Featured in IBD 50 (then known as IBD 100) and
                                                                       Jun 12
                                                         other features multiple times before breakout
                                                                       Mar 12
                                                                       Dec 11
                July 2009 – September 2012
                                                                       Sep 11
               Gain
                                                                       Jun 11
               381%
                                                                       Mar 11
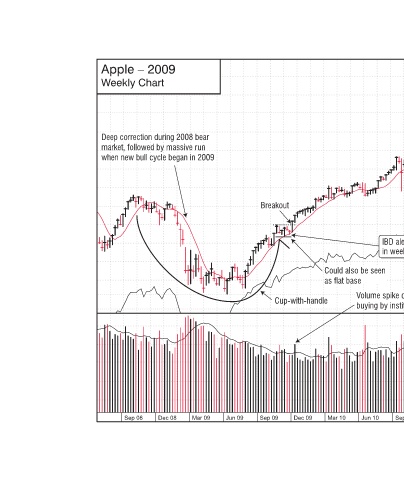
                                          IBD alerted readers to base
                                           in week before breakout
                                                    buying by institutional investors
                                                                       Dec 10
                                                                       Sep 10
                                              Could also be seen  100  90 as flat base  80 Volume spike on breakout: Shows heavy   The CAN SLIM Investment System 25
                                                                       Jun 10
                                                                       Mar 10
                                                   Cup-with-handle     Dec 09
                                    Breakout                           Sep 09
                                                                       Jun 09 Mar 09
             2009       Deep correction during 2008 bear  market, followed by massive run  when new bull cycle began in 2009  Dec 08
             –  Weekly Chart                                           Sep 08
             Apple
   1028   1029   1030   1031   1032   1033   1034   1035   1036   1037   1038