
Page 1188 - How to Make Money in Stocks Trilogy
P. 1188
Don’t Invest Blindly: Use Charts to See the Best Time to Buy and Sell 171
Support or Resistance at Specific Price Points
In addition to watching how a stock behaves around the moving average
lines, you also want to look for signs of support and resistance at certain price
areas. This is a vital part of understanding how and why the telltale chart pat-
terns we’ll discuss later help you pinpoint the best time to buy a stock.
And after you buy, this concept will also help you know whether you
should hold the stock because it’s building “stepping stones” by finding sup-
port at key areas—or if it’s time to sell because it crashed right through the
“floor.”
The following examples show you what support and resistance look like
on a chart. As you look at the notes in each example, pay particular attention
to that all-important relationship between price and volume.
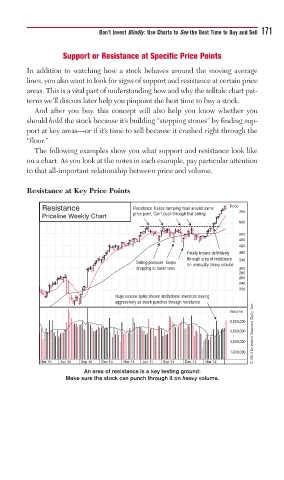
Resistance at Key Price Points
Resistance Resistance: Keeps bumping head around same Price
price point. Can’t push through that ceiling. 700
Priceline Weekly Chart
600
500
460
420
Finally breaks definitively 380
through area of resistance 340
Selling pressure: Keeps on unusually heavy volume
dropping to lower lows 300
280
260
240
220
Huge volume spike shows institutional investors buying
aggressively as stock punches through resistance
© 2013 Investor’s Business Daily, Inc.
Volume
8,000,000
5,000,000
3,000,000
1,800,000
Mar 10 Jun 10 Sep 10 Dec 10 Mar 11 Jun 11 Sep 11 Dec 11 Mar 12
An area of resistance is a key testing ground:
Make sure the stock can punch through it on heavy volume.