
Page 1187 - How to Make Money in Stocks Trilogy
P. 1187
170 HOW TO MAKE MONEY IN STOCKS—GETTING STARTED
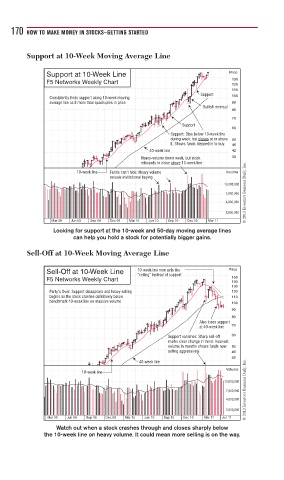
Support at 10-Week Moving Average Line
Support at 10-Week Line Price
130
F5 Networks Weekly Chart 120
110
Support
Consistently finds support along 10-week moving 100
average line as it more than quadruples in price 90
Bullish reversal
80
70
Support
60
Support: Dips below 10-week line
during week, but closes at or above 50
it. Shows funds stepped in to buy. 46
40-week line 42
Heavy-volume down week, but stock 38
rebounds to close above 10-week line
© 2013 Investor’s Business Daily, Inc.
10-week line Funds can’t hide: Heavy volume Volume
reveals institutional buying
13,000,000
7,000,000
4,000,000
2,000,000
Mar 09 Jun 09 Sep 09 Dec 09 Mar 10 Jun 10 Sep 10 Dec 10 Mar 11
Looking for support at the 10-week and 50-day moving average lines
can help you hold a stock for potentially bigger gains.
Sell-Off at 10-Week Moving Average Line
Sell-Off at 10-Week Line 10-week line now acts like Price
“ceiling” instead of support
F5 Networks Weekly Chart 150
140
130
Party’s Over: Support disappears and heavy selling 120
begins as the stock crashes definitively below 110
benchmark 10-week line on massive volume 100
90
80
Also loses support
at 40-week line 70
Support vanishes: Sharp sell-off 60
marks clear change in trend. Heaviest
volume in months shows funds now 50
selling aggressively. 46
42
© 2013 Investor’s Business Daily, Inc.
40-week line
Volume
10-week line
13,000,000
7,000,000
4,000,000
2,000,000
Mar 09 Jun 09 Sep 09 Dec 09 Mar 10 Jun 10 Sep 10 Dec 10 Mar 11 Jun 11
Watch out when a stock crashes through and closes sharply below
the 10-week line on heavy volume. It could mean more selling is on the way.