
Page 1183 - How to Make Money in Stocks Trilogy
P. 1183
166 HOW TO MAKE MONEY IN STOCKS—GETTING STARTED
Bullish vs. Bearish Reversals
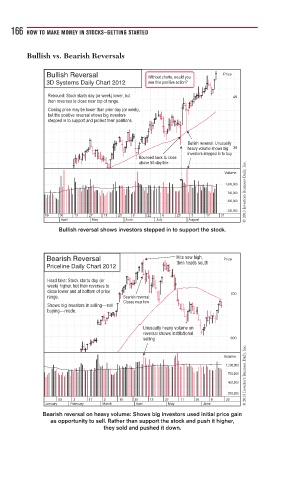
Bullish Reversal Without charts, would you Price
3D Systems Daily Chart 2012 see this positive action?
Rebound: Stock starts day (or week) lower, but 40
then reverses to close near top of range.
Closing price may be lower than prior day (or week),
but the positive reversal shows big investors
stepped in to support and protect their positions.
Bullish reversal: Unusually
heavy volume shows big 30
investors stepped in to buy
Bounced back to close
above 50-day line
© 2013 Investor’s Business Daily, Inc.
Volume
1,300,000
700,000
400,000
200,000
16 30 13 27 11 25 8 22 6 20 3 17 31
April May June July August
Bullish reversal shows investors stepped in to support the stock.
Bearish Reversal Hits new high, Price
then heads south
Priceline Daily Chart 2012
Head fake: Stock starts day (or
week) higher, but then reverses to
close lower and at bottom of price
range. Bearish reversal: 700
Closes near low
Shows big investors in selling—not
buying—mode.
Unusually heavy volume on
reversal shows institutional
selling 600
© 2013 Investor’s Business Daily, Inc.
Volume
1,200,000
700,000
400,000
200,000
20 3 17 2 16 30 13 27 11 25 8 22
January February March April May June
Bearish reversal on heavy volume: Shows big investors used initial price gain
as opportunity to sell. Rather than support the stock and push it higher,
they sold and pushed it down.