
Page 1248 - How to Make Money in Stocks Trilogy
P. 1248
230 HOW TO MAKE MONEY IN STOCKS—GETTING STARTED
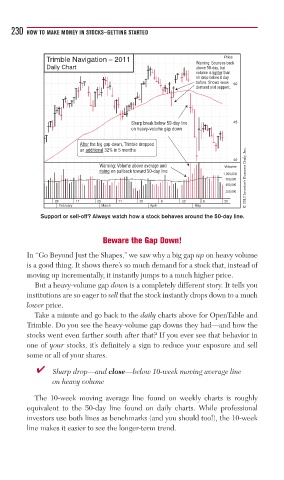
Trimble Navigation – 2011 Price
Warning: Bounces back
Daily Chart above 50-day, but
volume is lighter than
on drop below it day
before. Shows weak
50
demand and support.
Sharp break below 50-day line 45
on heavy-volume gap down
After the big gap down, Trimble dropped
an additional 32% in 5 months
40
Warning: Volume above average and Volume
rising on pullback toward 50-day line
1,200,000
700,000 © 2013 Investor’s Business Daily, Inc.
400,000
200,000
28 11 25 11 25 8 22 6 20
February March April May
Support or sell-off? Always watch how a stock behaves around the 50-day line.
Beware the Gap Down!
In “Go Beyond Just the Shapes,” we saw why a big gap up on heavy volume
is a good thing. It shows there’s so much demand for a stock that, instead of
moving up incrementally, it instantly jumps to a much higher price.
But a heavy-volume gap down is a completely different story. It tells you
institutions are so eager to sell that the stock instantly drops down to a much
lower price.
Take a minute and go back to the daily charts above for OpenTable and
Trimble. Do you see the heavy-volume gap downs they had—and how the
stocks went even farther south after that? If you ever see that behavior in
one of your stocks, it’s definitely a sign to reduce your exposure and sell
some or all of your shares.
■ ✔ Sharp drop—and close—below 10-week moving average line
on heavy volume
The 10-week moving average line found on weekly charts is roughly
equivalent to the 50-day line found on daily charts. While professional
investors use both lines as benchmarks (and you should too!), the 10-week
line makes it easier to see the longer-term trend.