
Page 1245 - How to Make Money in Stocks Trilogy
P. 1245
Don’t Invest Blindly: Use Charts to See the Best Time to Buy and Sell 227
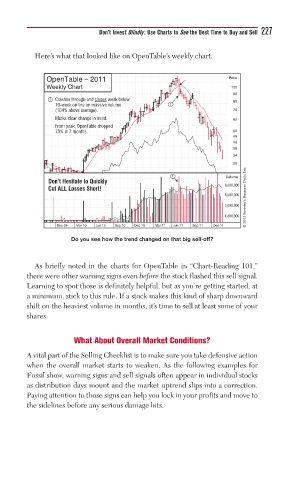
Here’s what that looked like on OpenTable’s weekly chart.
OpenTable – 2011 Price
Weekly Chart 100
90
1 Crashes through and closes week below 80
10-week on line on massive volume 1
(104% above average). 70
Marks clear change in trend. 60
From peak, OpenTable dropped
73% in 7 months. 50
46
42
38
34
30
© 2013 Investor’s Business Daily, Inc.
1 Volume
Don’t Hesitate to Quickly
8,000,000
Cut ALL Losses Short!
5,000,000
3,000,000
1,800,000
Dec 09 Mar 10 Jun 10 Sep 10 Dec 10 Mar 11 Jun 11 Sep 11 Dec 11
Do you see how the trend changed on that big sell-off?
As briefly noted in the charts for OpenTable in “Chart-Reading 101,”
there were other warning signs even before the stock flashed this sell signal.
Learning to spot those is definitely helpful, but as you’re getting started, at
a minimum, stick to this rule. If a stock makes this kind of sharp downward
shift on the heaviest volume in months, it’s time to sell at least some of your
shares.
What About Overall Market Conditions?
A vital part of the Selling Checklist is to make sure you take defensive action
when the overall market starts to weaken. As the following examples for
Fossil show, warning signs and sell signals often appear in individual stocks
as distribution days mount and the market uptrend slips into a correction.
Paying attention to those signs can help you lock in your profits and move to
the sidelines before any serious damage hits.