
Page 1249 - How to Make Money in Stocks Trilogy
P. 1249
Don’t Invest Blindly: Use Charts to See the Best Time to Buy and Sell 231
As we just saw, if a stock drops sharply below the 50-day line on extremely
heavy volume and closes at the bottom of its range, that’s a serious sign of
trouble. On the other hand, if volume is light and the stock bounces back to
close near the top of the day’s range and at or just below that benchmark
line, it could mean funds are buying shares to prop up the stock and protect
their positions.
To gauge how serious the selling is, also check the weekly chart.
Where Does the Stock Close for the Week?
You may find that after a day or two of selling, fund managers step in to buy
shares, and by the end of the week, the stock closes above or just under the
10-week line. That’s a sign of support.
However, if the stock breaks sharply below the 10-week line and closes
under it on heavy volume, that’s a sign of institutional selling, not support.
It’s often a precursor to more selling, meaning it’s time to protect yourself.
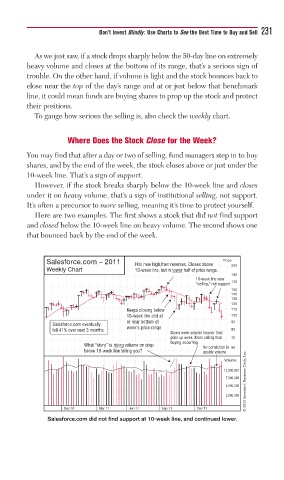
Here are two examples. The first shows a stock that did not find support
and closed below the 10-week line on heavy volume. The second shows one
that bounced back by the end of the week.
Salesforce.com – 2011 Price
Hits new high,then reverses. Closes above 220
Weekly Chart 10-week line, but in lower half of price range.
190
10-week line now
“ceiling,” not support 170
150
140
130
120
Keeps closing below 110
10-week line and at 100
or near bottom of 90
Salesforce.com eventually week’s price range
fell 41% over next 3 months 80
Down week volume heavier than
prior up week. More selling than 70
buying occurring.
What “story” is rising volume on drop No conviction in 60
below 10-week line telling you? upside volume
© 2013 Investor’s Business Daily, Inc.
Volume
12,000,000
7,000,000
4,000,000
2,000,000
Dec 10 Mar 11 Jun 11 Sep 11 Dec 11
Salesforce.com did not find support at 10-week line, and continued lower.