
Page 125 - How to Make Money in Stocks Trilogy
P. 125
© 2009 Investor’s Business Daily, Inc.
140,000
300,000
Volume
20,000
60,000
Price
120
140
100
60
50
80
70
26
22
30
40
34
8
7
5
6
S&P 500
Dec 1980
11/10
el
el
past channe
past channe
Sep 1980
n
Sell: goes
o
h
Sll l
Volume up
e
line
l line
e
p
p
s
p
Jun 1980
S
p
p
p
p
l
15-week cup
p
arket correction
eek c
o
u
Buy
V
e
u
e
15-w
15-w
Mar 1980
o
-
15
e
2/1
y up, no further selling
g
a
n
Ma
Dec 1979
e
e
r
Sep 1979
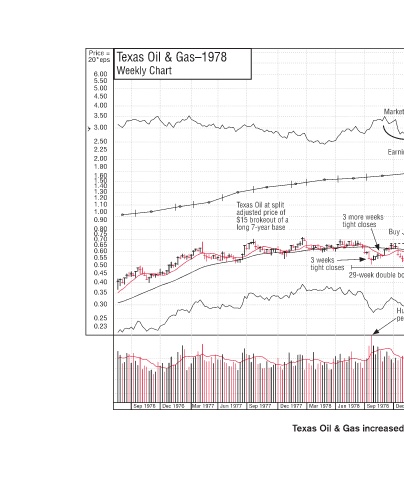
Texas Oil & Gas increased 529% in 101 weeks.
and volume dryp, , ,
Huge volume as price closes at
t
peak and part of 3 weeks tight
peak and part of 3 weeks tight
Add
Add
gh
s
Ad
A
Jun 1979
s
o
Add
Add
m
d
e
e
and volu
and volu
3 more weeks
o
r
s
Earnings acceleration
Mar 1979
tight closes
tight closes
Market correction
n
p
o
c
c
d
11/10
t
l
29-week double bottom
Dec 1978
g
p
r
e
Ea
Sep 1978
3 more weeks 19 Buy Buy u 6 weeks in-a-row tight row tight tight ght h o a 6 weeks in- s 6w 6 6 6 6 3 more weeks at base a eate a flat b ate a flat b closes create a flat a a a a c e c tight closes o g 16 Buy Bu 14 ks in a row tight closes and sup
e
Jun 1978
2
3 weeks s s tight closes tight closes s Mar 1978
Dec 1977
Texas Oil at split Texas Oil at split a T T adjusted price of p p p ju j j $15 brokeout of a 5 $ long 7-year base year base long 7 g Sep 1977 Jun 1977
o
p
a
Texas Oil & Gas–1978 Weekly Chart Mar 1977 Dec 1976 Sep 1976
Price = 20*eps 6.00 5.50 5.00 4.50 4.00 3.50 3.00 2.50 2.25 2.00 1.80 1.60 1.50 1.40 1.30 1.20 1.10 1.00 0.90 0.80 0.75 0.70 0.65 0.60 0.55 0.50 0.45 0.40 0.35 0.30 0.25 0.23