
Page 127 - How to Make Money in Stocks Trilogy
P. 127
60
A WINNING SYSTEM
160,000
20,000
Volume
80,000
40,000
Price
3.0
4.0
3.4
14
12
16
30
26
19
10
22
50
60
70
40
80
34
8
5
6
7
and closes in upper half
and closes in upper half
area “A” for a shakeout f f
of week’s spread—sign
sign
cup-with-handle
handle
undercuts low of prior
s
o
i
n
of week s spread—
a
k
of buying support t
p
Stock at point “B”
”
a
with
h
13-week
k
u
p
s
S&P 500
w
r
s
po
s
cup-
s
13
13
u
s
t
n
k
c
A
a “A
c
w
b
u
S
o
o
a
2/1
a
8 weeks up
p
u
in a row
Buy
Buy
k
o
u
B
B
Big volume
m
w
a
ts new high
h
g
o
pward
not buy
pward
y
not buy
g
a
A
b
A
A
A
A
A
A
w
o
Stock price wedges up
p
Stock price wedges up
p
n
along 2 lows, so do n
n
along 2 lows, so do n
week hits
when next week hits
e
d
means accumulation
n
3 weeks tight closes
3 weeks tight closes
ek
d
o
e
s
we
w
o
a
s
w
m
e
h
r
c
g
k
n
t
Market correction
n
Market correction
tight closes
s
tight closes
cup-with-handle
e
3 weeks
Buy
Buy
25-week big
u
h
i
r
e
t
M
2
c
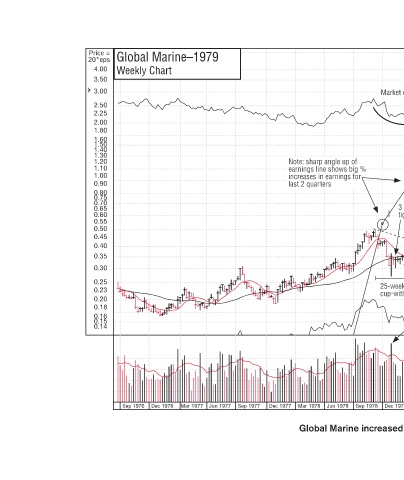
Sep 1978 Mar 1981 Dec 1980 Sep 1980 Jun 1980 Mar 1980 Dec 1979 Sep 1979 Jun 1979 Mar 1979 Dec 1978 © 2009 Investor’s Business Daily, Inc. Global Marine increased 752% in 94 weeks.
% o % i f g
Note: sharp angle up of a earnings line shows big % earnings line shows big % e increases in earnings for last 2 quarters e Jun 1978 Mar 1978
r
o
s
c
Dec 1977
Sep 1977
Jun 1977
Global Marine–1979 Weekly Chart Mar 1977 Dec 1976
Price = 20*eps 4.00 3.50 3.00 2.50 2.25 2.00 1.80 1.60 1.50 1.40 1.30 1.20 1.10 1.00 0.90 0.80 0.75 0.70 0.65 0.60 0.55 0.50 0.45 0.40 0.35 0.30 0.25 0.23 0.20 0.18 0.16 0.15 0.14 Sep 1976