
Page 126 - How to Make Money in Stocks Trilogy
P. 126
America’s Greatest Stock-Picking Secrets 59
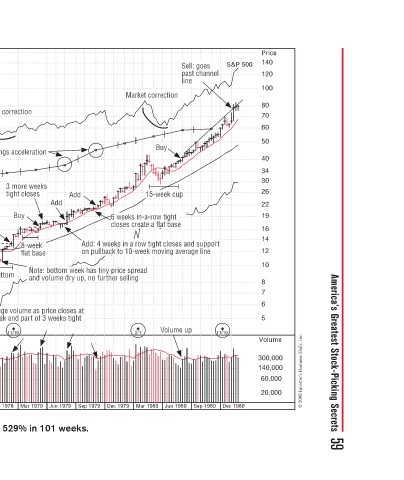
Price 140 120 100 80 70 60 50 40 34 30 26 22 19 16 14 12 10 8 7 6 5 Volume 300,000 140,000 60,000 20,000 © 2009 Investor’s Business Daily, Inc.
S&P 500 Dec 1980
el el n o 11/10
Sell: goes o Sll l S past channe past channe h s p l line e e line l p p p p u d l g e Volume up p p p Sep 1980 Jun 1980
arket correction o e o e Buy u 15-week cup eek c e 15-w 15-w - 15 6 weeks in-a-row tight row tight tight ght h o a at base a eate a flat b ate a flat b a a a ks in a row tight closes and support t o g w k to 10-week moving average line k to 10-week moving average line
Ma a 6 weeks in- s closes create a flat a c e eks in a n n e - a a p e g n e 2/1
Add: 4 weeks in a w on pullback back on pullback k bac u om week has tiny price sprea p n s y up, no further selling e r Dec 1979
6w
6
6
6
c
6
Add Add Ad A A o e t s gh Sep 1979
Add Add d 8-week 8-week flat base flat base e: bottom ottom Note: bottom tt tt b and volume dryp, , , m and volu and volu o Huge volume as price closes at o e r peak and part of 3 weeks tight peak and part of 3 weeks tight s e Jun 1979 Mar 1979
s
Market correction n c r Earnings acceleration c Ea 3 more weeks o tight closes tight closes t g Buy Buy u Buy Bu e l p d p 11/10 Dec 1978 Texas Oil & Gas increased 529% in 101 weeks.
3 more weeks 3 more weeks tight closes o 29-week double bottom e Sep 1978
g
s s 2 Jun 1978
3 weeks s tight closes tight closes Mar 1978
Dec 1977
Texas Oil at split Texas Oil at split a T T adjusted price of p p p ju j j $15 brokeout of a 5 $ long 7-year base year base long 7 g Sep 1977 Jun 1977
o
p
a
Texas Oil & Gas–1978 Weekly Chart Mar 1977 Dec 1976 Sep 1976
Price = 20*eps 6.00 5.50 5.00 4.50 4.00 3.50 3.00 2.50 2.25 2.00 1.80 1.60 1.50 1.40 1.30 1.20 1.10 1.00 0.90 0.80 0.75 0.70 0.65 0.60 0.55 0.50 0.45 0.40 0.35 0.30 0.25 0.23