Page 157 - How to Make Money in Stocks Trilogy
P. 157

© 2009 Investor’s Business Daily, Inc.
                                                            1,660,000
                                                             980,000
                                                               580,000
                                                                340,000
                                                                  200,000
                                                          Volume
           Price
                                               1.8
                                                       0.8
                                                 1.5
                                                     1.0
                                                   1.3
                         13
              36
                     19
                   23
                 27
                      16
                                                                     Mar 1992
                                                         2/1
                                                                     Dec 1991
               Sell: climax top
               p
           S&P 500
               x
               m
                                                                     Sep 1991
               S
                                                                     Jun 1991
                        Buy
                        u
                                                                     Mar 1991
                                                                     Dec 1990
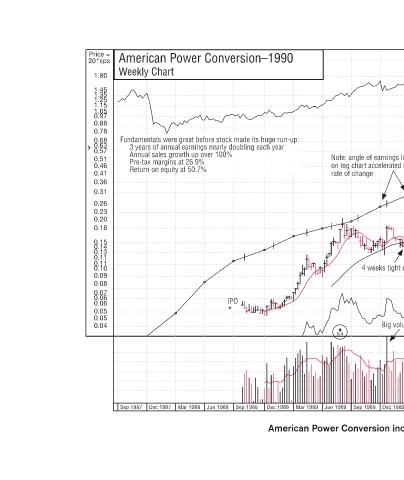
                                                                         American Power Conversion increased 745% in 96 weeks.
                                                         3/1
                                                                     Sep 1990
                                                       e Big volume demand
                                                      d
                                                      m
                                                      d
                                                                     Jun 1990
                                                      g
                                                                     Mar 1990
                                                       Big volume clue
                                                       Big volume clue
                                                       e
                            Note: angle of earnings line 11  e  a  a  9 on log chart accelerated in on log chart accelerated in  e  rate of change  7  6  e stock have more  v  h  o  s Hi-tech s  e  H  Buy  uy  B  4.6  s  s ks and shakeouts cks and shakeouts  a  a  pullback  pullback  ullback  pullba g b  s  Pullbac
                                                       m
                                                                     Dec 1989
                                                                     Sep 1989
                                                         5/4
                                                                     Mar 1989 Jun 1989 Dec 1988
                         up:
           American Power Conversion–1990  Fundamentals were great before stock made its huge run-up: Fundamentals were great before stock made its huge run  f  e     3 years of annual earnings nearly doubling each year  o  s  a  100%     Annual sales growth up over 100%  v  th  o  l Pre-tax margins at 26.9%  s  t5
                          c
          Price =  20*eps  Weekly Chart   1.80    1.45   1.35   1.25        1.15    1.05   0.97       0.88     0.78    e   0.68    0.63   r   0.57   l  a  A   0.51   a   0.46   n  t  R   0.41     0.36     0.31     0.26     0.23     0.20    0.18    0.15    0.14    0.13    0.11    0.11    0.10    0.09    0.08    0.07
   152   153   154   155   156   157   158   159   160   161   162