
Page 162 - How to Make Money in Stocks Trilogy
P. 162
America’s Greatest Stock-Picking Secrets 77
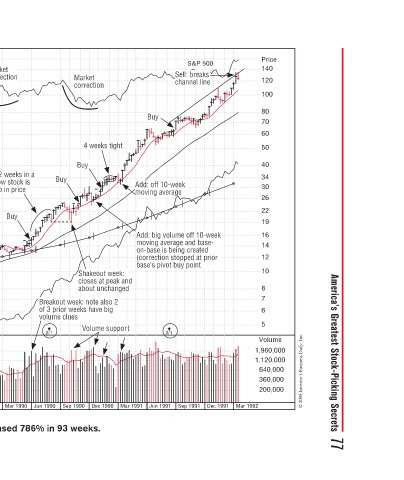
Price 140 120 100 80 70 60 50 40 34 30 26 22 19 16 14 12 10 8 7 6 5 Volume 1,960,000 1,120,000 640,000 360,000 200,000 © 2009 Investor’s Business Daily, Inc.
Mar 1992
k k e o Dec 1991
S&P 500 eaks Sell: breaks Sell: breaks k k re Sell: l l channel line channel line n e a k - s d a p p n Sep 1991
Add: off 10-week e 0 moving average g g g e Add: big volume off 10-week Add: big volume off 10-week m o moving average and base- g a ve on-base is being created (correction stopped at prior (correction stopped at prior t n base’s pivot buy point b o 2/1 Jun 1991
c
S
Buy y B f g g g v i d g g v s b c r e
Add
Add
m
A
d d Mar 1991
t t h t e w closes at peak and n k p about unchanged anged g h 2 o l Volume support t pp p p s
Market e a correction o e o 4 weeks tight 4 weeks tight e w Buy Buy B B B Shakeout week: Shakeout week: o a S s c about uncha u a Breakout week: note also 2 te k k of 3 prior weeks have big of 3 prior weeks have big v h k m l Vo Dec 1990 Sep 1990
Buy a Buy u t w u k B w volume clues u e 2/1 Jun 1990
Market Market k correction e 12 weeks in a i k 12 row stock is w up in price ice pinp Buy Mar 1990
Dec 1989 United States Surgical increased 786% in 93 weeks.
Sep 1989
Jun 1989
Mar 1989
Dec 1988 Sep 1988
United States Surgical–1990 Weekly Chart Jun 1988 Mar 1988 Dec 1987
Price = 20*eps 7.00 6.50 6.00 5.50 5.00 4.50 4.00 3.50 3.00 2.50 2.25 2.00 1.80 1.60 1.50 1.40 1.30 1.20 1.10 1.00 0.90 0.80 0.75 0.70 0.65 0.60 0.55 0.50 0.45 0.40 0.35 0.30 0.25