
Page 160 - How to Make Money in Stocks Trilogy
P. 160
76 A WINNING SYSTEM
Price 80 70 60 50 40 34 30 26 22 19 16 14 12 10 8 7 6 4.5 3.8 3.2 2.8 Volume 12,000,000 7,000,000 4,000,000 2,000,000 © 2009 Investor’s Business Daily, Inc. Mar 1992
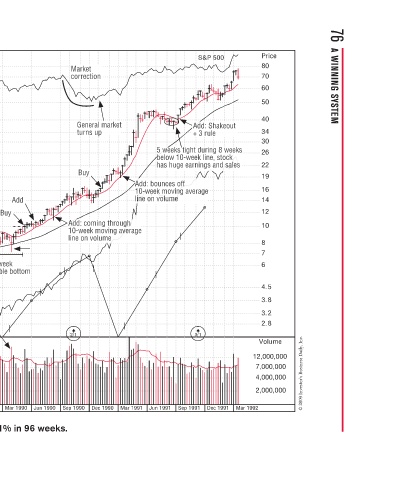
S&P 500 Add: Shakeout t e h Ad Ad A A e + 3 rule +3 rule r + 5 weeks tight during 8 weeks k e 8 w g g i ht d ti ig i k k k 5 we w 5 w below 10-week line, stock o , i e - o b b les ales sales e has huge earnings and sal has huge earnings and sa s s a g n
n General market t e a l p s : A A A A A week 10-we w li Add: coming through h gh g o g t verage e g e ve 10-week moving av i m e l Mar 1991 Dec 1990
Market t t Mk r correction correction c r e G turns up turns up u y Buy B o : Ad Ad A A e w 1 line on volume l 2/1 Sep 1990
Jun 1990
m
Add Add Mar 1990
Buy Buy B 16-week week w double bottom
16
eout keout k n upper- in upper- n k p Dec 1989 Amgen increased 681% in 96 weeks.
Stock in shake Stock in shake Stock in shake oc o o closes in closes in closes in area closes area c e half for week, shows or week r wee f volume support volume support Sep 1989
St
Jun 1989
Mar 1989 Dec 1988
New drug for cancer c u chemotherapy patients. chemotherapy patients. t i i ti th h Sep 1988 Jun 1988
Mar 1988
Amgen–1990 Weekly Chart Dec 1987
Price = 20*eps 3.00 2.50 2.25 2.00 1.80 1.60 1.50 1.40 1.30 1.20 1.10 1.00 0.90 0.80 0.75 0.70 0.65 0.60 0.55 0.50 0.45 0.40 0.35 0.30 0.25 0.23 0.20 0.18 0.16 0.15 0.14 0.13