
Page 175 - How to Make Money in Stocks Trilogy
P. 175
84
A WINNING SYSTEM
3,000,000
1,600,000
800,000
400,000
200,000
Volume
Price
2.4
4.5
2.8
3.8
3.2
12
22
30
40
50
70
34
60
26
16
10
19
14
6
7
8
line on volume closing near
ine on volume closing near
f
g
g
g
3/2
10-week moving
Add: rebound of
e
10-week moving average
rebounds off pullback to
o
3 weeks tight and stock
ov
c
g
k
r
average line
peak, so could hold
o
b
a
o
l
S&P 500
k
o
Volume up
p
g
e
u
n
a
r
p
p
e
8 weeks more
8 weeks more
m
e
h
o
u
f
o
0
d
o
k
v
d
o
s
s
Big volume
u
o
,
m
w
k
3/2
0
correction
n
pe
n
e
l
After third round of holding for 8 weeks, stock
ti
k
, ,
Market
could try to hold for 12-month long-term gain
n
n
e
c
is up from 7 to 24, over 240%, due to results
c
After third round of holding for 8 weeks, stoc
is up from 7 to 24, over 240%, due to results
Big
s
last 2 weeks, so must hold
g
After holding for 8 weeks,
almost 12 and big volume
almost 12 and big volume
u
t t
a
r
s
s
o
ks
u
p
r
p
Vo ume up
e
r
k
stock is up from 7 to
stockisupfrom7to
m
g
7
e
8 w
8
m
another 8 weeks.
another 8 weeks
o
olu
u
23-week cup-
o
m
8
d
8
8
o
8
k
p
p
p
Dry-up
p
ek
with-handle
handle
%
from buy point, must hold
Stock is up 20% in 1st we
Buy
Market correction
Market correction
n
w
y
f f f f
n
n
a
w
y
l
o
k
u
n
m
ldin
e
c
e
h
1
s
2
ldi
weeks then reassess.
weeks then reassess.
with
2
s
u
e
s
t
f ho
n
h
r
k
2
or possible climax top
f h
%
n
o
l
a
t
t
,
d o
A
a
t
d
d
p 2
o
lim
r
n
M
u
h
c
o
y
d
d
b
d
m
d
ibl
s
b
thi
thi
IPO
Aft
Aft
*
*
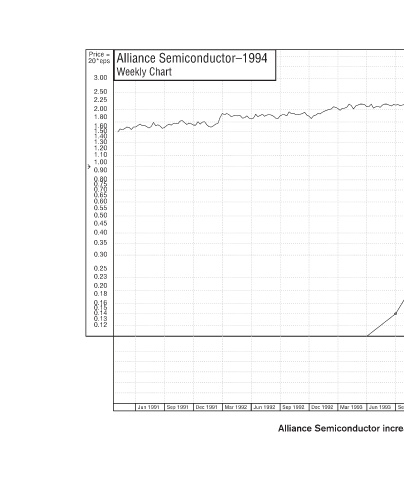
Jun 1993 Sep 1995 Jun 1995 Mar 1995 Dec 1994 Sep 1994 Jun 1994 Mar 1994 Dec 1993 Sep 1993 © 2009 Investor’s Business Daily, Inc. Alliance Semiconductor increased 539% in 47 weeks.
Mar 1993
Dec 1992
Sep 1992 Jun 1992
Alliance Semiconductor–1994 Mar 1992 Dec 1991 Sep 1991 Jun 1991
Price = 20*eps Weekly Chart 3.00 2.50 2.25 2.00 1.80 1.60 1.50 1.40 1.30 1.20 1.10 1.00 0.90 0.80 0.75 0.70 0.65 0.60 0.55 0.50 0.45 0.40 0.35 0.30 0.25 0.23 0.20 0.18 0.16 0.15 0.14 0.13 0.12