
Page 201 - How to Make Money in Stocks Trilogy
P. 201
© 2009 Investor’s Business Daily, Inc.
1,660,000
580,000
340,000
200,000
980,000
Volume
Price
3.0
2.6
4.0
3.4
2.2
50
40
34
60
Dec 2004
Sep 2004
Jun 2004
S&P 500
Mar 2004
Dec 2003
keout
t t
Big volume
Big volume
e
Big volume
m
ke
e
Shak
Sep 2003
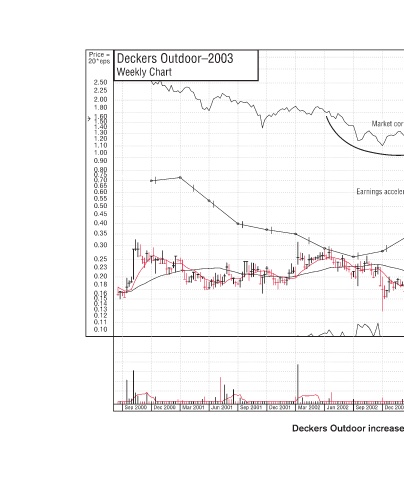
Deckers Outdoor increased 766% in 88 weeks.
o
h
Jun 2003
Mar 2003
Market correction 30 Market correction n n c r 26 22 19 16 14 week f 10-week k e 10- Add: off f 1 Add: off 1 o d ge ng average r g a ing moving n n m 12 Earnings acceleration Earnings acceleration n n i e on volume o n line o ne o 10 Buy B 8 7 Buy B 6
Dec 2002
Jun 2002 Sep 2002
Mar 2002
Dec 2001
Sep 2001 Jun 2001
Deckers Outdoor–2003 Weekly Chart Mar 2001 Dec 2000
Price = 20*eps 2.50 2.25 2.00 1.80 1.60 1.50 1.40 1.30 1.20 1.10 1.00 0.90 0.80 0.75 0.70 0.65 0.60 0.55 0.50 0.45 0.40 0.35 0.30 0.25 0.23 0.20 0.18 0.16 0.15 0.14 0.13 0.12 0.11 0.10 Sep 2000